| Corcoran Technical Trading Patterns For April 11 |
| By Clive Corcoran |
Published
04/11/2011
|
Stocks
|
Unrated
|
|
|
|
Corcoran Technical Trading Patterns For April 11
During my absence last week - which was due to unexpected eye surgery - many of the themes discussed during the commentaries for the prior week have unfolded. In particular EUR/JPY performed very much in accordance with the discussion outlined here on March 31 and revisited again below; gold has moved ahead confidently after breaking above the $1445 resistance level and the development of most consequence is the ongoing rise in WTI (and Brent Crude) towards the $120 target level.
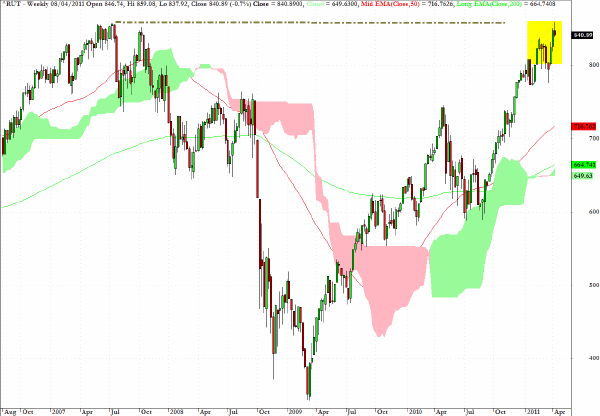
The Russell 2000 registered a new historic intraday high of 859 last Wednesday but closed out the week at the 840 level. As the weekly chart suggests there is a clear possibility that an interim double top pattern may be evolving and for the time being, having been notably bullish on the micro cap stocks for some time, the safest stance may be one of removing or minimizing exposure to this sector.
Here is my comment from the March 31 newsletter.
The chart for WTI Crude futures (May contract) is displaying a pattern on the 240-minute chart which has the appearance of an evolving cup with handle formation.
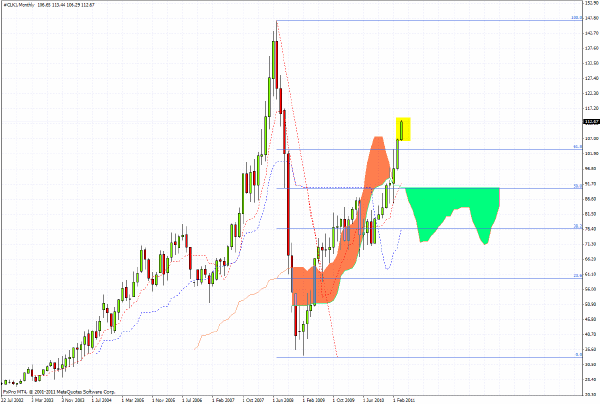
Using a monthly chart, the high values on this contract just shy of $150 per barrel seen in the summer of 2008 are clearly visible as is also is the plunge back towards $30 a barrel in early 2009.
Using a fibonacci grid it can be seen that the current price has surpassed the 62% retracement level and without any cloud formation to penetrate, a case could reasonably be made that this contract has the possibility to move a lot further. Also worthy of attention is the exchange traded fund, BNO, which tracks the price of Brent Crude - which has been in the vanguard of the move higher in crude - and which has been trading in the mid $120’s.
While I was away from my desk during most of last week I did leave my position in place for EUR/JPY and as it turned out price development followed very much the path indicated in my last commentary before my eye operation. Here again is what I said on March 31.
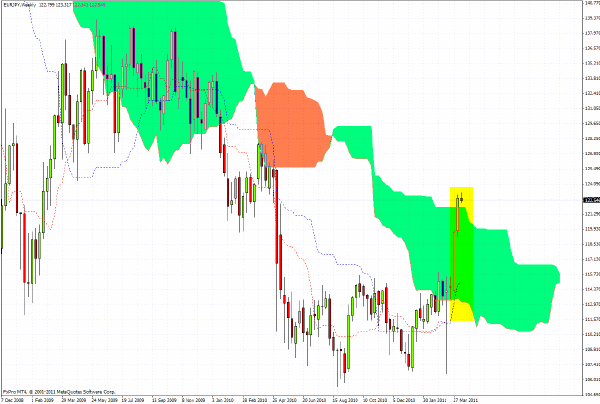
EUR/JPY is approaching the top of a well defined range or channel on its daily chart which has prevailed for more than a year
The critical level is 116 and a break above that level would open up a move to the 120 level which is indicated as the target level of the weekly Ichimoku chart pattern.
Of all the FX possibilities at present for position traders this one would appear to be one of the most compelling on the long side. I would plan to exit part of the position at 120 and even leave a smaller remainder for a possible move to the actual top of the cloud at 122.
As we are now above the weekly cloud formation I'll sit on the sidelines and see how the pattern develops during the course of this week.
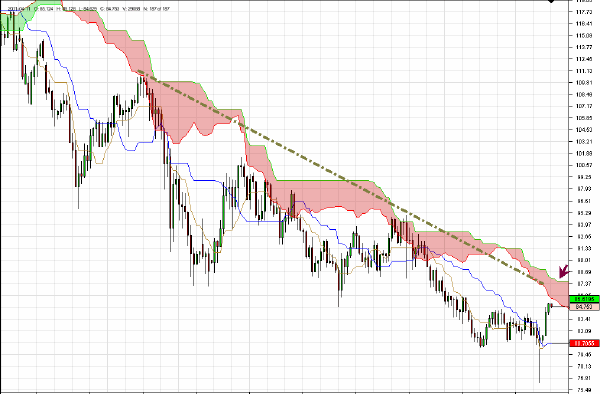
The Japanese yen has continued to slide against the US dollar (and all other crosses) but it may be that the easy money on USD/JPY has been made in the near term.
The dollar appears to be stalling at the 85 level and even if we should reach into the cloud formation on the weekly chart, the 87.30 level would provide further strong resistance.
The sector fund DBV, a proxy for the FX carry trade, has made an extraordinary recovery since the abrupt drop which followed the tragic events in Japan which occurred exactly one calendar month ago.
The fund provides long futures positions on the three G10 currencies associated with the highest interest rates and short futures positions on the three currencies associated with the lowest interest rates.
In my presentation at the International Traders Expo in London last Friday (and I decided to present wearing an eye patch in pirate mode - althoug I refrained from bringing the parrot) I discussed this chart and the follwing chart in some detail as a way of illustrating the dynamics of the carry trade.
As discussed, the DBV fund presents a very simple and effective way for those traders who do not trade on a spot FX platform and yet who want to have a vehicle - via an ETF - which enables them to take a view on the direction of the high yielding currencies, primarily the Australian and Canadian dollars.
Asked by one of the conference participants for my longer-term views on the commodity currencies, I suggested that there is good reason to believe that these will continue to out-perform the US dollar and euro but when asked if they might become the new safe haven currencies I suggested that the volatility of the Australian dollar for example would not lend itself to be considered as such.
5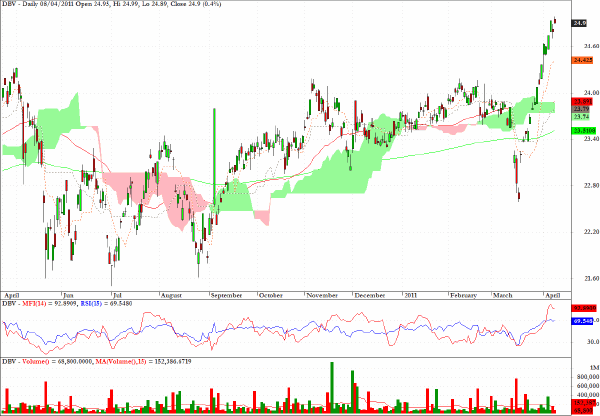
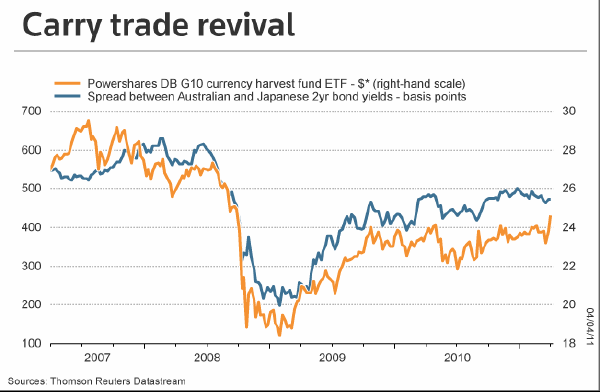
The last chart for today’s commentary shows in a very useful fashion the foundations of the FX carry trade.
Tracked in blue is the spread between 2-year Australian and Japanese bonds and the actual spread values can be read on the left hand scale in basis points. The orange line tracks the path taken by the DBV fund discussed above and the right hand scale tracks the price of this ETF.
Just one qualification which would need to be inserted into the outlook for the yield differentials is the fact that there should be a a slow and persistent upward bias to Japanese interest rates will have the effect of squeezing the spread, although there is still a sufficiently large spread to expect the changes to the appeal to the carry trade to be minor in the intermediate term.
Clive Corcoran is the publisher of TradeWithForm.com, which provides daily analysis and commentary on the US stock market.
|