| Corcoran Technical Trading Patterns For April 12 |
| By Clive Corcoran |
Published
04/12/2011
|
Currency , Stocks
|
Unrated
|
|
|
|
Corcoran Technical Trading Patterns For April 12
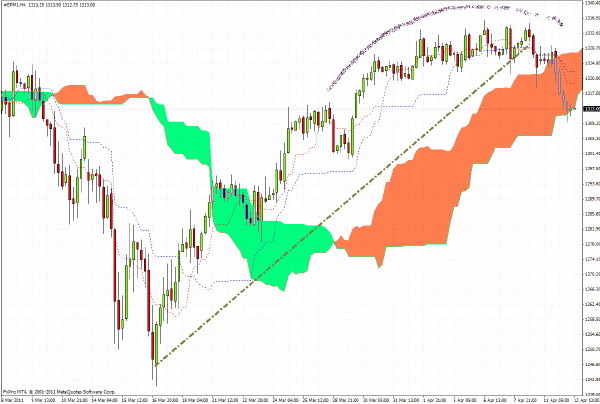
S&P 500 futures have been sliding since yesterday’s North American close and are now positioned at 1312 which is a level of some significance as it marks a drop below the cloud formation on the 240-minute chart as seen below. Also, as annotated on the chart, there is evidence of a rather foreboding dome formation in progress.
There are layers of price support in the 1300-1310 region but if these were to be taken out today then I would be targeting a potential retest of the 1280/5 zone.

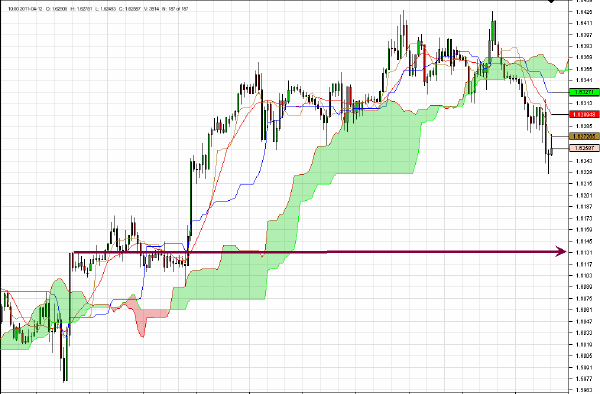
Sterling is suffering from a double whammy in European trading. Retail sales for March came in at -3.5% on a like for like basis which is the worst level since the British Retail Consortium started collecting data more than 16 years ago. Also the March CPI number showed an easing of inflation which reduces the likelihood of an imminent BOE base rate hike.
The drop below 1.6280 opens up lower levels and the target over the next couple of sessions, I would suggest, is as indicated by the arrow on the chart at approximately 1.6130.

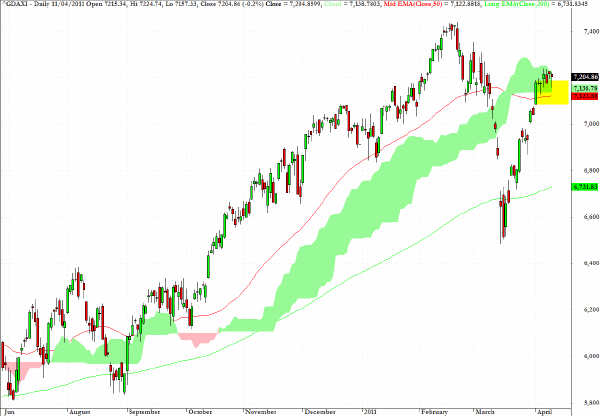
Germany’s DAX index is off about one percent at the time of writing and faces a test at the 7125 level which is at the intersection of both the 50-day EMA and the base of the cloud formation.
Volume analysis on the DAX is also revealing negative divergences where selling is accompanied by higher volume than seen during those sessions when the index moves up.

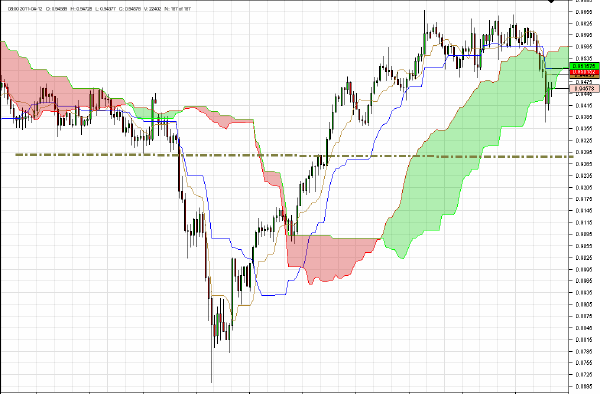
As I discussed last Friday at the Traders Expo seminar in London, my preferred metric at present for gauging overall or macro risk appetite is AUD/CHF which in overnight trading reflecting, among other developments, new concerns about the Fukushima situation, dropped below a key trend line and the cloud formation on the 2400minute chart.
In my estimation, it would be prudent to be looking at overall risk off positioning if this pair breaks below 0.93.

Clive Corcoran is the publisher of TradeWithForm.com, which provides daily analysis and commentary on the US stock market.
|