| Corcoran Technical Trading Patterns For April 13 |
| By Clive Corcoran |
Published
04/13/2011
|
Stocks , Currency
|
Unrated
|
|
|
|
Corcoran Technical Trading Patterns For April 13
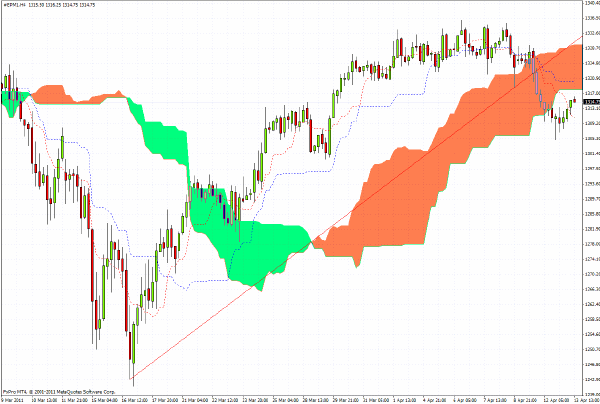
The 4-hour chart for the S&P 500 futures shows some recovery in Asian/European trading and the challenge now is for the index to re-enter the overhead cloud formation.
European markets are taking some relief from the drop in crude prices and this also helped the Indian market to a two percent plus gain, as discussed below.
I would expect to see the bulls try to regain control of the agenda while the energy/metals complex is taking a rest - partly inspired by a cautious note from Goldman Sachs yesterday which advised clients to lighten up exposure on certain industrial commodities. The fact that GS also trades those commodities for its own account does not apparently pose any conflict of interest problems-- must be those inimitable "Chinese walls".
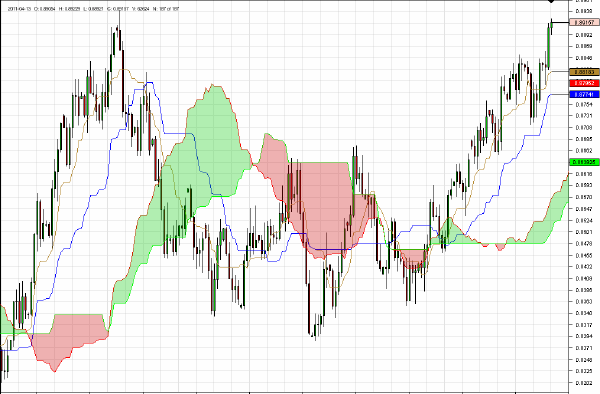
My prognosis for sterling yesterday - an intermediate-term target of $1.6130 - has not materialized but reviewing the chart for EUR/GBP there is a possible double top in formation, but my hunch is that since it appears too obvious and could attract a flourish of short selling, there could be a lot of counter currents in the cross trading of euro/sterling which could result in driving the UK currency down against the euro.
Therefore I would wait for a decisive drop below $1.62 before looking to instigate a GBP/USD short position with a target of $1.6130. If it doesn’t come in today’s session then I would stand aside.
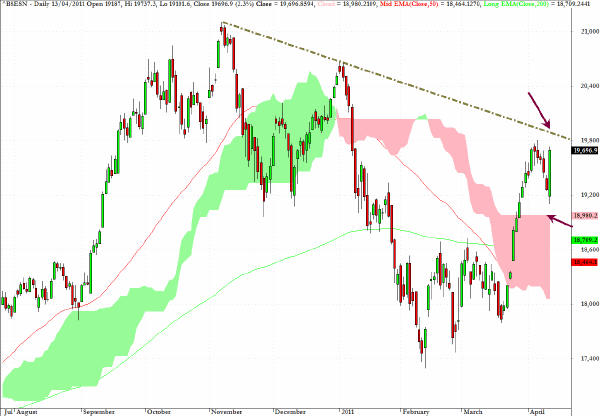
The Mumbai Index had a strong session with a 2.3% gain.
There is now very firm support for this index at the 19,000 level but a clear obstacle to overcome at the 20,000 level - as indicated by the descending trendline through recent highs.
While this range-bound condition continue,s the preferred stance would be to buy setbacks but not become too committed on the long side until the 20,000 level is firmly broken on a closing basis. There are US traded ETF’s which provide exposure to Indian equities, including INP, IFN and INXX.
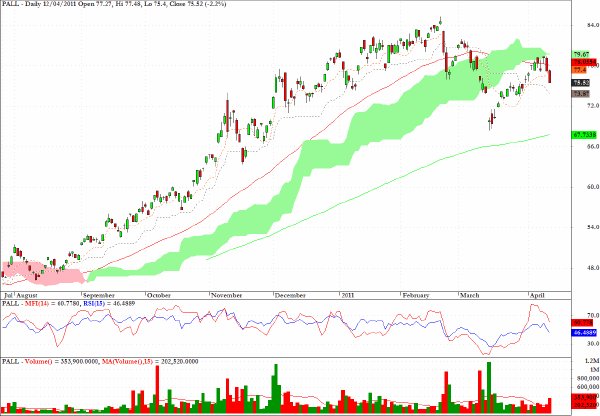
PALL, an exchange traded fund which tracks the industrial and semiprecious metal palladium, looks vulnerable after dropping below support levels.
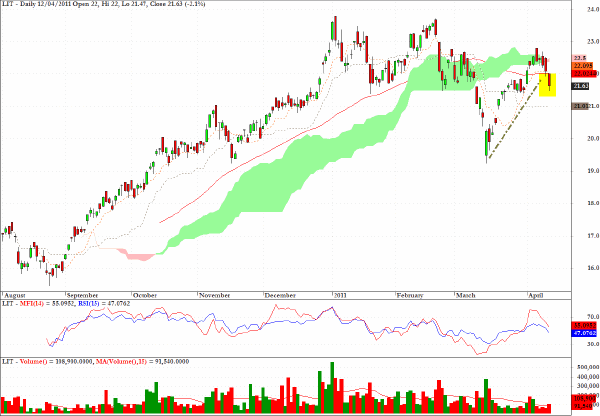
LIT, is an ETF which tracks the performance of the Solactive Global Lithium Index, and along with a number of charts for strategic metals, the pattern suggests that a corrective phase may have begun.
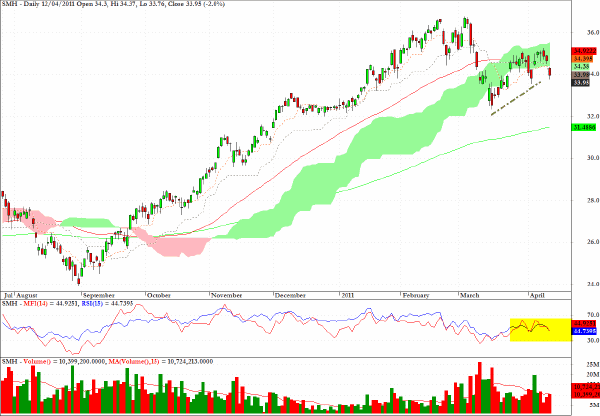
One of the least attractive sectors, from a technical perspective, is the semiconductor sector which has reached down to a test of trendline support, and also below the green cloud pattern.
A feasible target in the medium term would be a test of the 200-day EMA at approximately $31.50.
Clive Corcoran is the publisher of TradeWithForm.com, which provides daily analysis and commentary on the US stock market.
|