| Corcoran Technical Trading Patterns For April 15 |
| By Clive Corcoran |
Published
04/15/2011
|
Currency , Stocks
|
Unrated
|
|
|
|
Corcoran Technical Trading Patterns For April 15
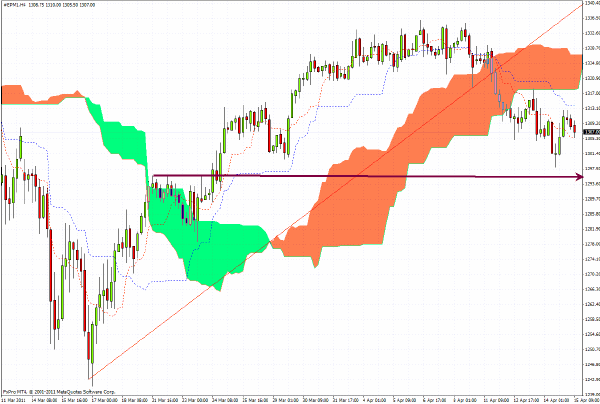
The 240-minute chart for the S&P 500 futures, which I find useful because it is not such a commonly used time window, illustrates clearly that the index has been grinding further below the cloud formation. The dome formation which I discussed here earlier in the week continues to unfold but the suspicion is that there are several constituencies that are keen to support the index from a decisive drop below 1300.
The base of the cloud at around 1320 will act as a firm resistance, and I would suspect that a test of the 1295 level (at least) lies ahead in the next few sessions.

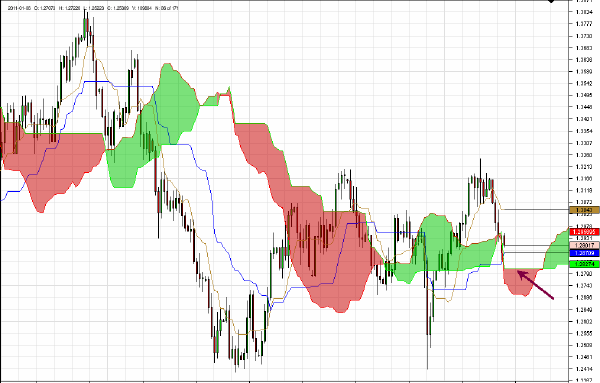
The strength of sterling and the euro - although the latter is now beginning to show some signs of fatigue - has been somewhat surprising to me this week. In essence their strength underlines the fact that the US dollar just cannot get any respect at all, to quote one of the best known lines of Rodney Dangerfield.
The precarious nature of the sovereign debt of Greece is weighing somewhat on the EZ currency, but in contrast to the outright flight from the euro almost one year ago when Greece had to be rescued, the fact that the dollar is not showing any safe haven behavior is noteworthy.
The one currency which will be the beneficiary of capital flight from the EZ will be the Swiss franc which is why from both a fundamental and technical point of view I am holding a short EUR/CHF position for the intermediate term.

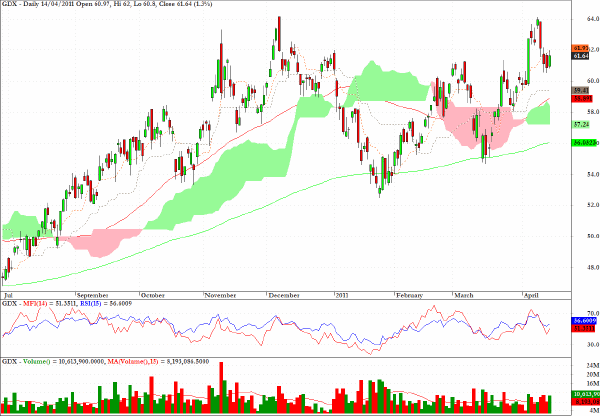
GDX is an exchange traded fund which tracks the gold mining sector, and, while the metal is moving steadily towards the $1500 level, the charts for individual miners such as Newmont Mining (NEM) are showing bullish patterns.
I would anticipate another attempt by GDX to break above the recent highs just above $64 in coming sessions.

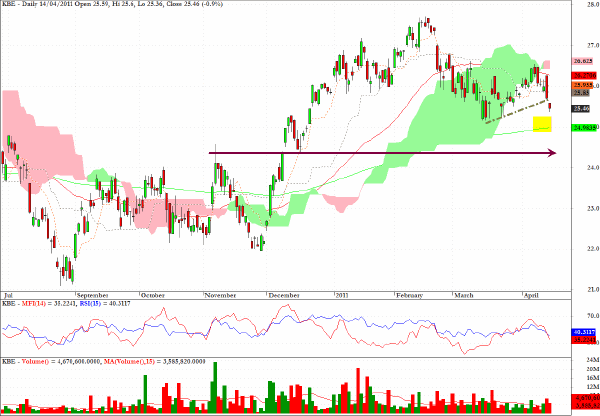
KBE, which tracks the KBW Banking Index, looks vulnerable to further setbacks but would definitely be a candidate for the long side if it should reach down to the $24.50 level, as indicated by the arrow on the chart.

Clive Corcoran is the publisher of TradeWithForm.com, which provides daily analysis and commentary on the US stock market.
|