| Corcoran Technical Trading Patterns For April 19 |
| By Clive Corcoran |
Published
04/19/2011
|
Currency , Stocks
|
Unrated
|
|
|
|
Corcoran Technical Trading Patterns For April 19
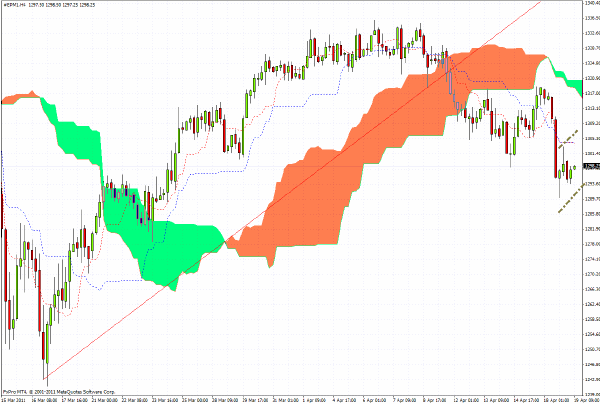
In European trading this morning the 240-minute chart for the S&P 500 futures shows that the index has barely budged from its close at the end of North American trading on Monday.
The futures reached as low as 1290 during Monday’s session but managed to find support which brought the index back to the 1300 level.
It is conceivable that the index could pull back towards the 1320 level but in so doing a bearish flag pattern would have evolved. A test of the mid 1280’s remains a distinct possibility over the next few sessions.
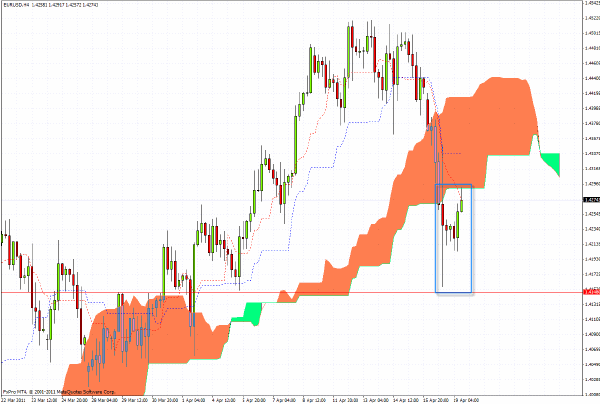
EUR/USD is now within a box outlined by previous support at $1.4280 at the top and the key test level at $1.4150 at the base as the support line shown in red on the 240-minute chart below.
The overall directional bias appears now to be downwards, but for the time being I would play this cautiously and tend to look at opportunities of cross-rate trading against sterling, based on the current patterns for EUR/GBP which indicates that sterling is finding more of a bid in its rate against the euro.
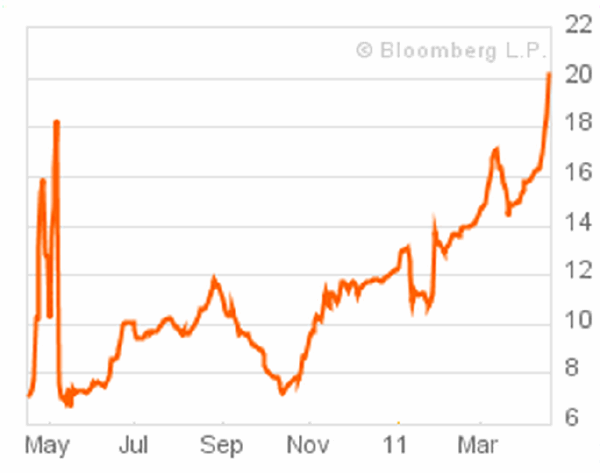
The following chart from Bloomberg shows just one of the several risk aversion factors which caused some of the turmoil across global markets yesterday. The graphic shows that the effective yield on two-year notes of the Greek government has exceeded 20%. Surprisingly the Greek government continues to deny any allegations that it will need to restructure its sovereign debt.
The euro had already begun to react negatively to this news before the S&P announcement added further pressure across the FX markets, although whether or not there are long-term consequences for the major currencies vis a vis the US dollar from the negative outlook issued by S&P remains somewhat doubtful as the USD has already been unloved for several months.
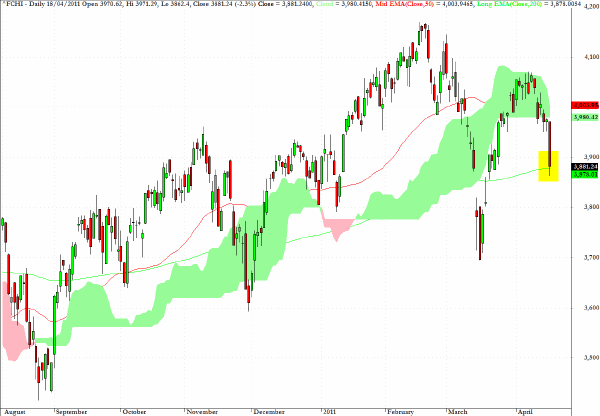
I'll repeat my comments from yesterday on the CAC40 as the index closed exactly at the 200-day EMA as the comments below suggested.
France’s benchmark index, the CAC 40, is revealing relative weakness in European trading on Monday morning.
A principal reason cited for the weakness is the relatively large exposure of French banks to Greek sovereign debt, although the situation for German banks is as, if not more, troublesome.
Support on the CAC 40 should be found at the 200-day EMA and readers are reminded that the exchange traded fund, EWQ, provides an opportunity to take a position on the MSCI index for French equities.
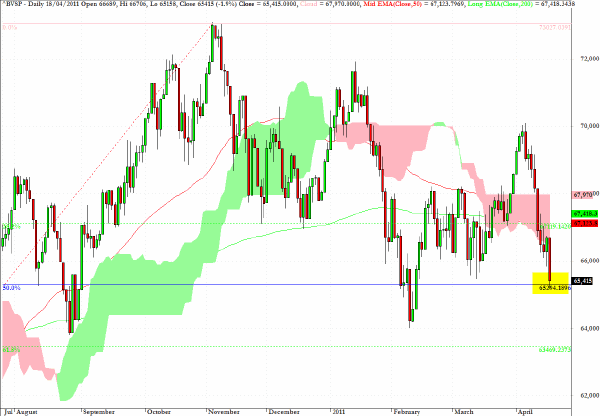
The Brazilian Index (BVSP) closed yesterday’s negative session at exactly the 50% retracement level between the highs and lows illustrated on the chart, which could provide an opportunity for a bounce in today’s session. The exchange traded fund, EWZ, provides a vehicle for taking a position on Brazilian equities.
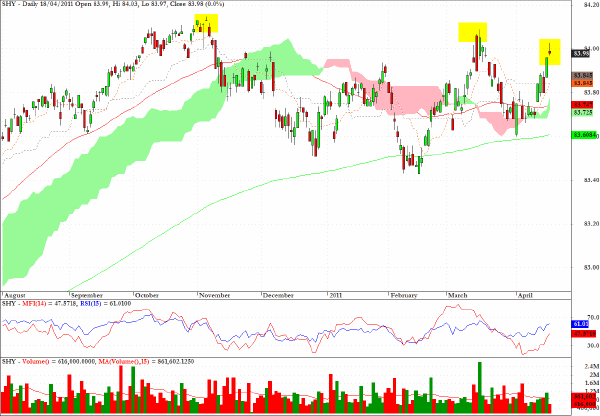
SHY, an exchange traded fund which captures the price performance of the 1-3 yr spectrum of UST’s, shows that, contrary to some expectations, the S&P announcement on the ratings outlook for the US could be disruptive to the Treasury market. There was in fact, as discussed in this column yesterday, a heightened desire by many fund managers to exit all kinds of risk assets and hide out in the short end of the yield curve.
Technically the pattern of lower highs suggests that there appears to be, despite the occasional and abrupt dashes into safe haven assets, an underlying downward bias to prices and accordingly an upward bias to yields in this key part of the Treasury yield curve.
Clive Corcoran is the publisher of TradeWithForm.com, which provides daily analysis and commentary on the US stock market.
|