| The Wagner Daily ETF Report For April 19 |
| By Deron Wagner |
Published
04/19/2011
|
Stocks
|
Unrated
|
|
|
|
The Wagner Daily ETF Report For April 19
The stock market sold off sharply on Monday but closed well off the lows. All of the major indices traded down by as much as 2.3% during the session. The plunge was led by small and mid cap stocks. The small-cap Russell 2000 and the S&P MidCap 400 dropped by 1.8% and 1.6% respectively. The Nasdaq, S&P 500 and Dow Jones Industrial Average all shed 1.1% on the day. Yesterday's price action left both the Nasdaq and the S&P 500 below critical support of the 50-day MA.
Despite the sharp intraday reversal, Monday's internals suggest a distribution day for the broad market. Volume was up across the board. Turnover on the NYSE rose by 4% and on the Nasdaq by a modest 1.3%. The disparity between declining volume and advancing volume was noticeable. Declining volume overwhelmed advancing volume by a ratio of 9.5 to 1 on the NYSE and 4.2 to 1 on the Nasdaq. The combination of higher volume and significantly higher declining volume supports the likelihood that institutions were involved in yesterday's selling.
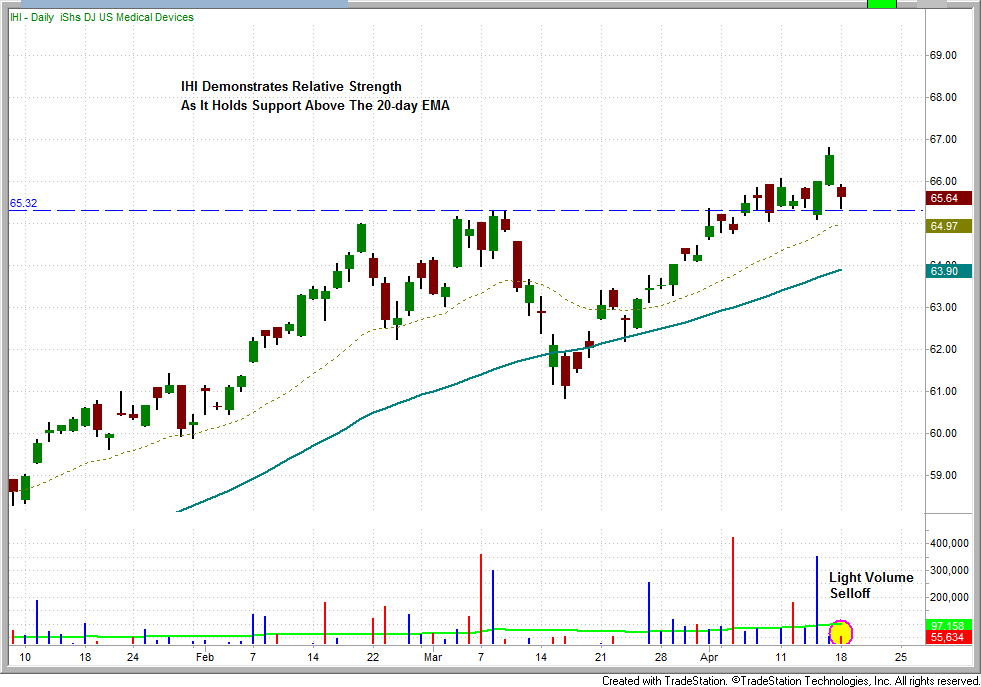
When massive intraday swings occur in the market we often use this as an opportunity to identify ETFs that are exhibiting relative strength and relative weakness as possible trade setups. During volatility the best potential trades are often those exhibiting these characteristics. Stocks showing relative strength will often provide the best buying opportunity when the market rallies and vice versa. IHI presents a good example of an ETF exhibiting relative strength, while RKH is demonstrating relative weakness.
Although the iShares Dow Jones US Medical Devices ETF (IHI) moved with the broad market yesterday (down 1.5% vs. 1.5% for NYSE), it has shown enormous relative strength to the broad market over recent months. While the market has been unable to move to a new high, IHI has recently set a new 52-week high. Further, it has done so on expanding volume, while yesterday's selloff was on light volume.

The Regional Bank HOLDRS ETF (RKH) provides a good example of an ETF that is demonstrating relative weakness. Yesterday RKH slightly underperformed the market (down 1.6%). However, over the past several months RKH has spent most of its time trading below its 20-day EMA and the 50-day MA. Further, it lost support of these key marks well ahead of today's distribution, has formed a head and shoulders like technical pattern, and broke below the key support level of the March 17th swing low of $83.81 yesterday. Based on the head and shoulders like pattern formed by this ETF we would expect further downside and a breach of the 200-day MA.

It is common to see sharp reversals and an increase of volatility during trend reversals. If we are in the early stages of a trend reversal, yesterday's intraday price reversal could be expected. For the moment, there is no confirmation that a downtrend is underway. However, with the Nasdaq 100, Nasdaq Composite and S&P 500 failing to reclaim support of the 50-day MA it is not unreasonable to project a short-term correction.
Deron Wagner is the Founder and Head Trader of both Morpheus Capital LP, a U.S. hedge fund, and MorpheusTrading.com, a trader education firm.
|