| Corcoran Technical Trading Patterns For April 21 |
| By Clive Corcoran |
Published
04/21/2011
|
Stocks , Currency
|
Unrated
|
|
|
|
Corcoran Technical Trading Patterns For April 21
Having spent the last two days in rural South Wales, where I was mentoring a client, I returned to witness some fairly extraordinary behavior (in my estimation at least) in the markets yesterday. Nearly everything scanned on the daily charts this morning - FX pairs against the USD, ETF’s (except the inverse ones) and most commodities - seem to have enjoyed large opening gap ups and considerable gains.
My estimation of the directional bias in EUR/USD turned out to be completely wrong although events this morning with the out-performance of sterling against the euro did validate my suggested trading stance in Tuesday’s letter.
After trading many different markets and writing commentaries for several years I have learned that one should always accept what is clearly visible on the charts. And what is clearly visible is a bipolar market, where we could move from Monday’s gloomy view of the EZ and its currency and a general risk aversion, to, within the space of 24 hours, an all-out embracement of risk assets.
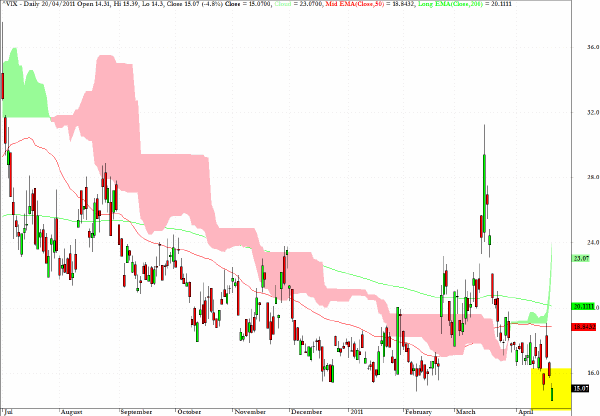
The chart for the VIX below shows that we gapped down in yesterday’s session and registered the lowest level on this indicator in well over a year. What is even more extraordinary is that just one month ago we saw levels above 30 - twice yesterday’s value.
Bipolar markets are not easy to trade for the inexperienced, but once one develops the mental agility to completely change one’s assessment of the prevailing macro risk condition at the drop of a hat (quaint old English expression) then the ability to gain from strongly trending behavior - even if it is the complete converse of market conditions just 24 hours ago becomes relatively profitable. I would suggest that it is not likely to be too fruitful to try to figure out whether Monday’s fear or Tuesday’s exuberance is the more valid long-term outlook....wait and see what the charts reveal in coming sessions.

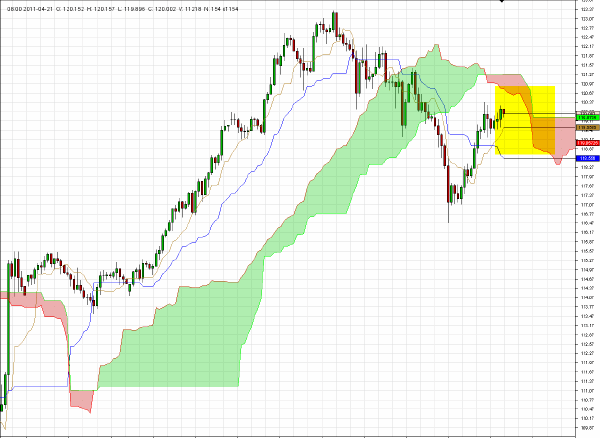
The yen is gaining strength against the dollar - which is not to say too much as just about every currency in the world is doing the same - but the chart for EUR/JPY strikes me as one where the projected cloud formation suggests that there could be a correction back towards the 118 level over the next few sessions.

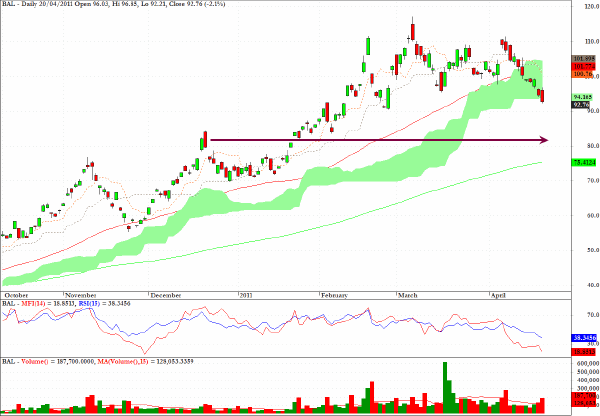
BAL, an exchange traded fund which tracks the performance of cotton futures contracts, seems to be technically vulnerable and a retreat to the level indicated by the arrow, or the 200-day EMA just below that, seems feasible in coming sessions.

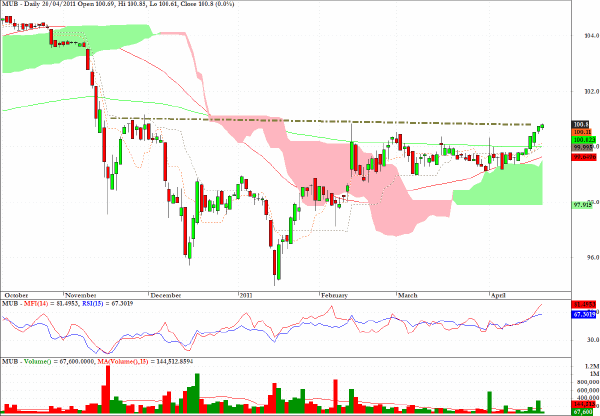
The basing pattern on the daily chart for MUB suggests that this proxy for US municipal debt appears to be poised for a break above current levels.
The only cautionary qualification I would insert is that the MFI and RSI readings are at elevated levels already so if the break does not occur in today’s session I would be looking to exit the position at the end of the day.

Clive Corcoran is the publisher of TradeWithForm.com, which provides daily analysis and commentary on the US stock market.
|