The weekly chart for the USD/CHF pair shows that the Swiss currency continues to benefit from its status as the safe haven currency without equal as the flight out of the US dollar continues unabated.
The S&P 500 futures are currently testing the intraday high of 1337.25 from April 21, which was itself the highest level seen since June 2008.
The 240-minute chart below suggests that a clean break above 1340 - which would validate an interpretation of the pattern as a cup with handle - could see the index move sharply upwards. As the US dollar remains under pressure, those asset allocators that use a different base currency need higher nominal US equity prices to preserve asset price parity with competing indices denominated in stronger currencies. 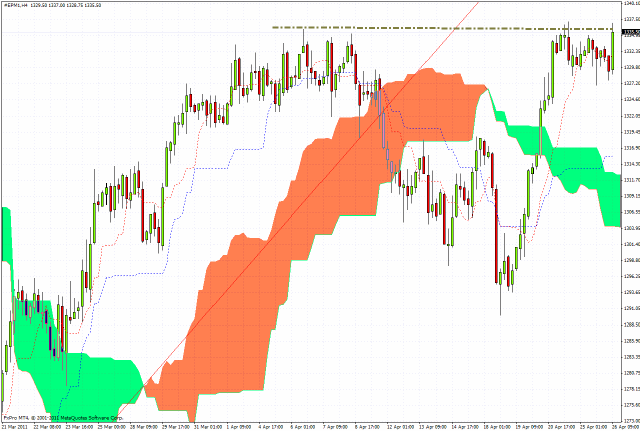
The fibonacci grid which has been overlaid on the daily chart for the Nikkei 225 shows that since the alarming events of March 19 the Japanese index has spent much of the recent past hovering between the 50% and 62% retracement levels of the high/low seen on the chart.
The index dropped back by 1.2% in Asian trading Tuesday and is now poised at exactly the 50% level. Further weakness would suggest that the 38% retracement level at 9240 would be a feasible target in coming sessions. 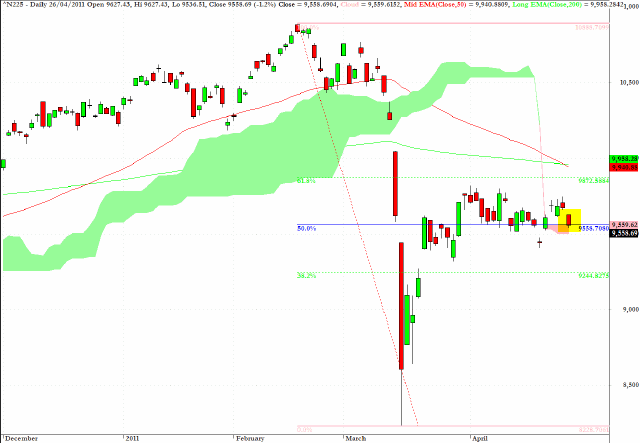
The weekly chart for the USD/CHF pair shows that the Swiss currency continues to benefit from its status as the safe haven currency without equal as the flight out of the US dollar continues unabated.
In fact, within the last 24 hours the Swiss franc has achieved a new post World War II high against the US currency at 0.8744. Recently I mentioned in this commentary that I am holding, for the long term, a short EUR/CHF position and despite the recent strength in the EZ currency the position has already seen a sizable gain, and a revisit to the 1.25 level on this pair would not be surprising. 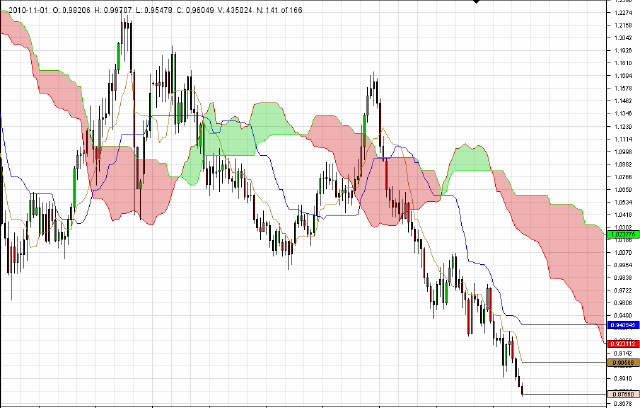
The Shanghai Composite index lost almost one percent and has clearly revealed a difficulty in maintaining a foothold above the 3000 level. A minor uptrend line has been violated but the bigger picture suggests that this index will need a hefty momentum whack to rechallenge the critical 3200 level which I have discussed here before. 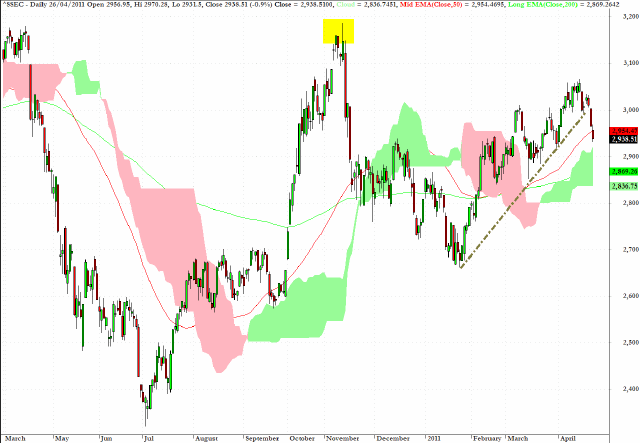
EUR/USD has penetrated the downward sloping trendline through the highs, extending back to the historic double top at $1.60 achieved in 2008, on the weekly chart.
Despite ongoing difficulties with sovereign debt for many EZ states - there are virtually no private sector buyers for the debt of Portugal, Ireland and Greece - the euro continues to move higher with a $1.50 target now a distinct possibility. My hunch is that the PBOC is helping to propel the euro higher as it divests itself of some of its dollar denominated assets, and many funds that were big players on the short side have been taken by surprise at the robust upward trajectory of what is still, in my estimation at least, the creation of a flawed currency union. 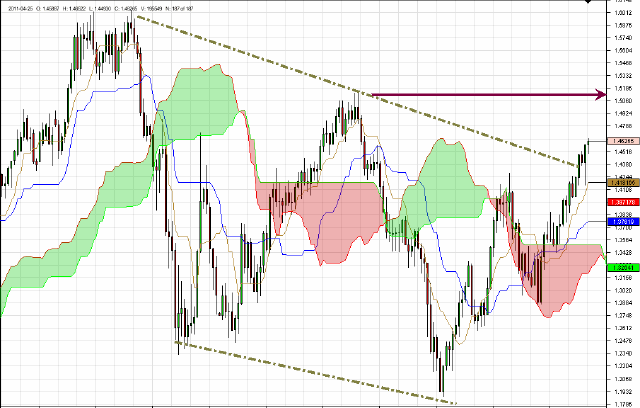
The daily chart for XME, which tracks the metals and mining sector, reveals that money flow is not supportive for this sector, and a feasible short-term target would be the cloud formation at 69.70 - and considering that the cloud is very "thin" on the chart at this level, there may not be that much support on offer. 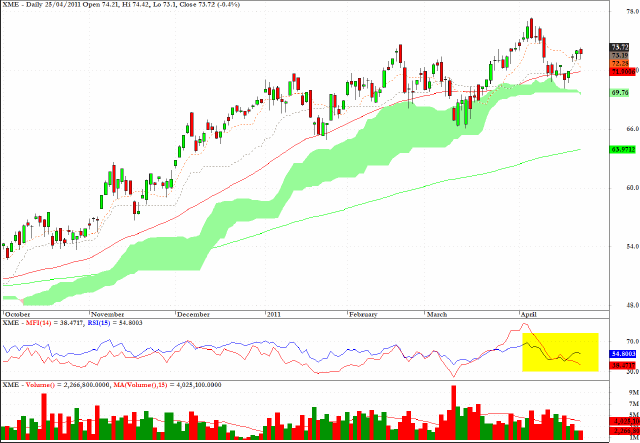
KBE, which tracks the KBW Banking Index, is touching the 200-day EMA where some near-term support should be found, but for the longer term the chart suggests that the $24 level would provide an even more attractive entry point on the long side. 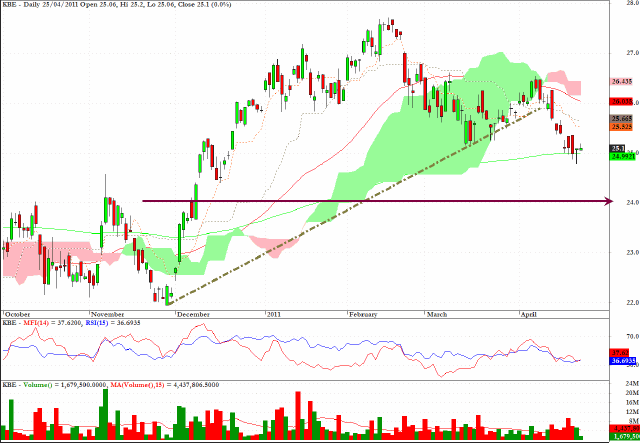
Clive Corcoran is the publisher of TradeWithForm.com, which provides daily analysis and commentary on the US stock market.