| Corcoran Technical Trading Patterns For April 27 |
| By Clive Corcoran |
Published
04/27/2011
|
Stocks
|
Unrated
|
|
|
|
Corcoran Technical Trading Patterns For April 27
Equity traders who have aligned themselves with the implications of the old adage "Don’t fight the Fed" over the last several months have been on the right side of the market - and yesterday was yet further validation that the path of least resistance for US equities right now is decidedly upwards - at least while the dollar cannot find any support from global fund managers.
Yesterday I made the following comment about the formation on the S&P 500 futures which turned out to be a fairly accurate reading of what happened in yesterday’s session.
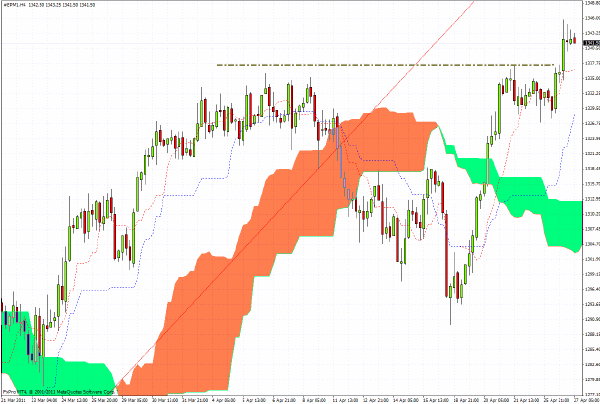
The 240-minute chart suggests that a clean break above 1340 - which would validate an interpretation of the pattern as a cup with handle - could see the index move sharply upwards.
Having decisively moved above the previous recent high of 1338, and then 1340, the futures rallied up to 1346, and as the 240-minute chart reveals (captured during early morning European trading on Wednesday), a pennant formation is developing. While yesterday’s breakthrough looks convincing it is now quite critical for the bulls, who are targeting much higher levels, that the 1338 previous resistance should now act as reliable support.

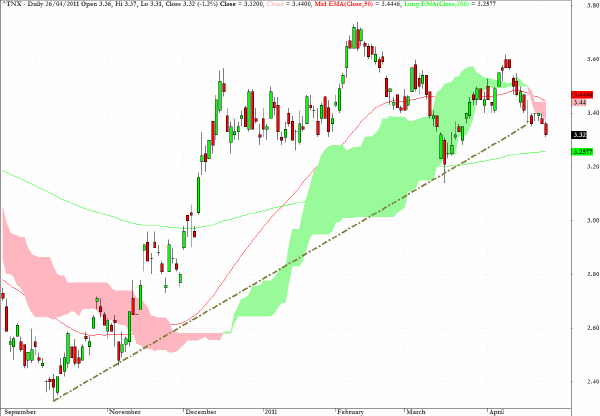
I have not commented much recently on the US Treasury complex as yields, especially at the long end of the curve, have been moving down despite the evidence that there are signs of a real pickup in economic activity in the US (just how much of this increased activity is due to the tsunami of easy money and daily POMO purchases is another matter), plus the continuing barrage of naysayers claiming that UST’s are in the midst of a major bubble.
PIMCO has stated recently that, in its opinion, the US economy has reached the Keynesian endpoint and that the Ponzi party is almost over, but this has not deterred many institutions from continuing to load up on UST’s. Part of the explanation goes back to the discussion from last week about the bi-polarity which is so evident in present day markets - with some quant fund players seeking out as much risk as they can find (comforted by the Fed’s declared aim of supporting asset prices as a top priority), while other just cannot stomach the occasional mishaps which cause those same risk assets to plunge on negative news developments.
The 10-year UST is now approaching its 200-day EMA at 3.25% and the risk/reward trade-off would suggest that the balance is now tipping in favor of shorting the 10-year note - and this can be done via a long position in the exchange traded fund, TBT.

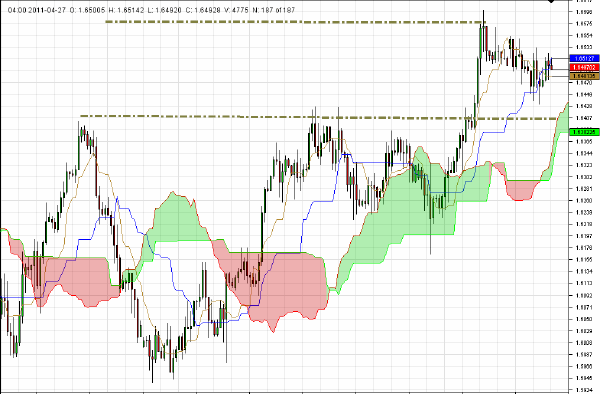
GBP/USD behaved more erratically than usual during yesterday’s session with some abrupt whipsaw behavior. The probable cause that kept the traders in London and New York on edge was the release today by the UK’s Office for National Statistics of the preliminary reading for Q1, 2011 GDP for the UK.
The Q4, 2010 number showed a contraction which surprised many, and the number due today is expected to be just slightly positive. As can be seen from the 240-minute chart sterling is well supported around $1.64 and has failed to penetrate $1.66. A stronger than expected number today could propel sterling though the $1.66 barrier, but should the $1.64 level fail to hold I would expect a revisit to the $1.6280 level.

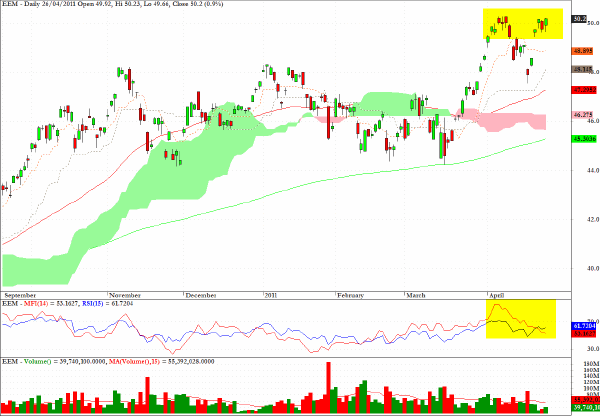
Although it was difficult in daily scanning today to find many charts where the price trajectory looked as though anything other than further price gains seemed likely, the chart for EEM caught my eye based on the clear negative divergence between the price action and the highlighted section on the MFI chart.
However, somewhat against my preference for looking for at least one or two charts each day which would support a short recommendation, for the time being I am respectful of the power of the Fed to get its own way with US equities - even though when translated back into a hard currency (such as the Swiss franc) those price gains are more or less illusory.

Clive Corcoran is the publisher of TradeWithForm.com, which provides daily analysis and commentary on the US stock market.
|