| Corcoran Technical Trading Patterns For May 3 |
| By Clive Corcoran |
Published
05/3/2011
|
Stocks , Currency
|
Unrated
|
|
|
|
Corcoran Technical Trading Patterns For May 3
After a royal wedding, the death of Osama bin Laden and an extended bank holiday weekend in the UK, returning to the trading arena reveals that there are some interesting new dynamics at work in the markets.
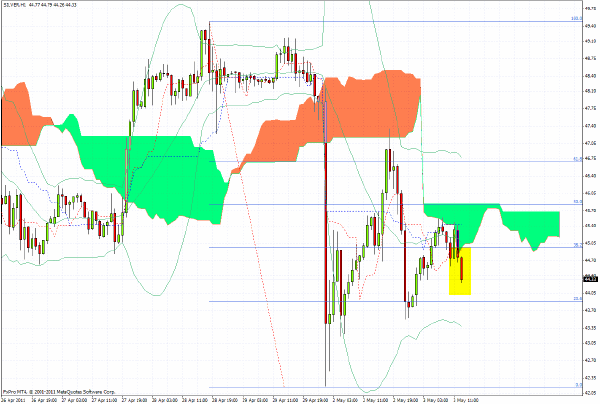
One of the most notable has been the sharp selloff in silver which dropped $6 /oz in the course of just one hour during the overnight session on Monday morning (following the news about bin Laden). Spot silver then staged a rather remarkable recovery during the North American session yesterday but once again the selling has resumed and the metal appears to be struggling at a fairly critical juncture.
Here again is my comment from last Thursday’s commentary.
The weekly chart for spot silver is developing the kind of parabolic price behavior which could, in my estimation, lead to a blood bath at some point in the not too distant future.
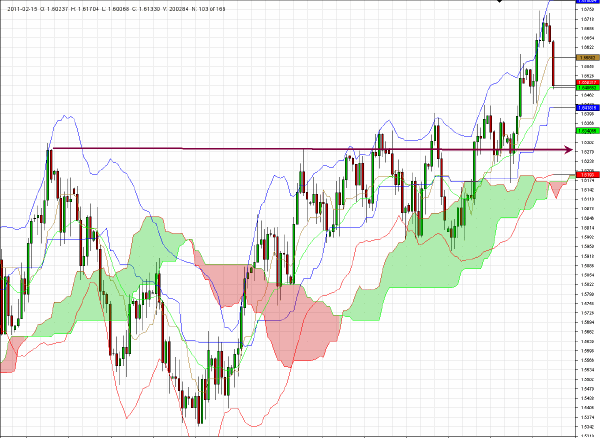
In a speech yesterday to the EU Commission, the BOE’s governor Mervyn King spelled out quite lucidly the case for continuing with a very accommodative monetary policy - not only for the UK but also for continental Europe. Whether this would impact on the ECB’s thinking is doubtful but the case for the hawks within the UK’s MPC faces an uphill battle with King so, apparently, committed to maintaining the historically low base rate of 0.5% for the foreseeable future.
UK PMI numbers also released this morning were weaker than expected and sterling has been on the back foot since. There is support around the $1.6420 level which appears to be on the radar for testing as this is being written, but I shall stand by the view expressed here about a week ago that in the medium term (i.e. next few weeks) sterling should seek out a retest of the pivotal $1.6280 level.
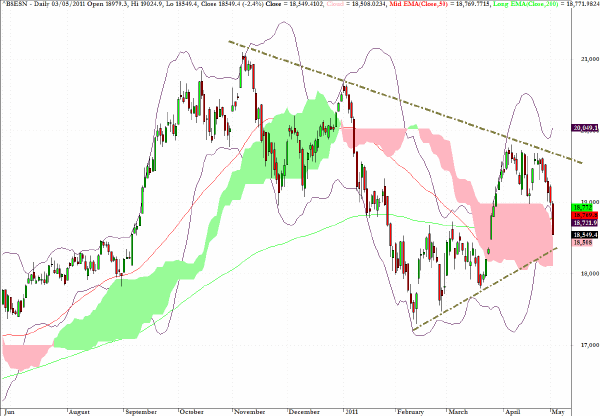
The Mumbai Exchange closed down with a 2% plus loss after the Indian central bank hiked its short-term rates by 50 bps rather than the expected 25 bps.
Reviewing the technical condition of the index, the triangular formation - highlighted by the descending trendline through the most recent highs - indicates that this index will soon reach an important inflection point and, while containing inflationary pressures remains very much at the forefront of the central bank’s agenda, the resolution of this price convergence at the apex becomes rather critical for those (including myself) who are long-term bulls on this key BRIC market.
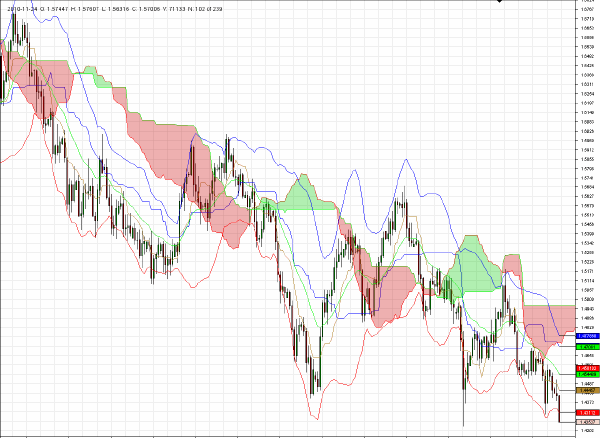
GBP/CHF is breaking down to new multi-year lows as the Swiss franc continues to benefit from flight to safety for many global asset allocators.
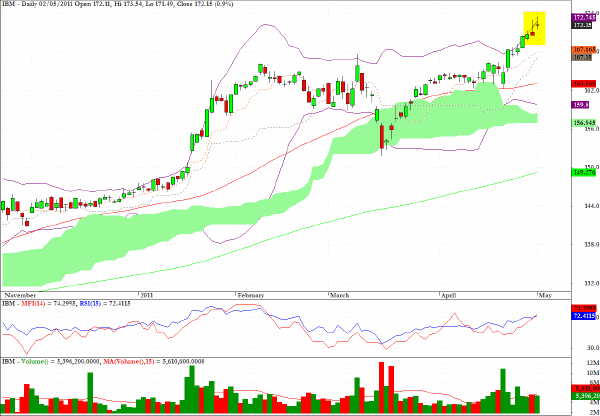
The daily chart for IBM, which has recently been registering all-time highs, reveals a rather noteworthy doji star following the previous session’s shooting star candlestick. This candlestick sequence can be a precursor to a change or pause in the current trend, although, it must also be acknowledged, the volume and money flow characteristics still look technically supportive.
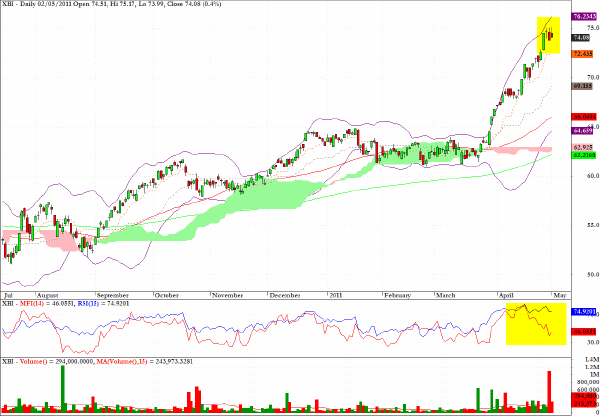
Many ETF’s look rather over-extended at current levels, and even though the Fed’s stance is still supportive of higher equity prices in general, XBI in particular caught my eye for both its negative volume divergences as well as the fact that it has been tagging the upper Bollinger band during the last couple of sessions.
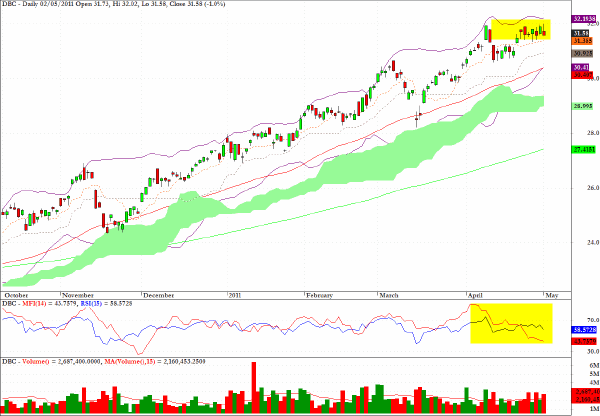
DBC, a sector fund tracking overall commodity prices, is revealing some negative MFI and RSI divergences.
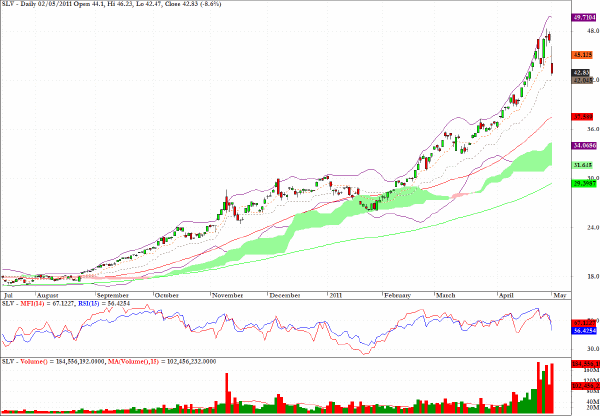
SLV, the exchange traded fund for silver, reveals the very heavy volume that has come into this sector as a consequence of the first real correction in the almost parabolic rise of the last year.
The 50-day EMA around $38 could be an aggressive target for those who sense that, while gold may still be an attractive asset on the long side, the junior precious metal has plenty of scope for further retracement of the extraordinary gains since last summer.
Clive Corcoran is the publisher of TradeWithForm.com, which provides daily analysis and commentary on the US stock market.
|