| Corcoran Technical Trading Patterns For May 5 |
| By Clive Corcoran |
Published
05/5/2011
|
Stocks , Currency
|
Unrated
|
|
|
|
Corcoran Technical Trading Patterns For May 5
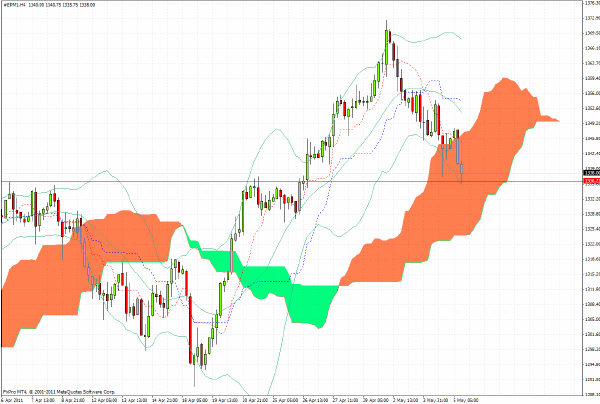
There is a line of chart support illustrated on the 240-minute chart for the S&P 500 futures which is very close to the current level around 1336.
However, several technical indicators are at high risk levels raising the possibility of large scale risk on asset liquidations so I will be standing aside on US equities until the FX/commodities backdrop becomes more transparent, which I would expect to occur during the next 36 hours of trading.
A break below 1325 could bring out a band wagon of short sellers - and especially worth monitoring in trading today and tomorrow is the performance of USD/JPY as the abrupt strengthening of the yen was the trigger to the flash crash which occurred exactly one year ago tomorrow.
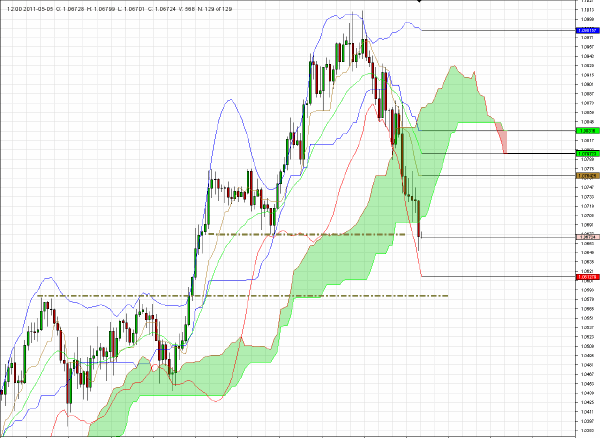
The BOE has not budged - which was not a surprise - nor has M. Trichet which was perhaps a little bit surprising. But weak economic data in Australia plus the unwinding of some large risk on trades is causing a lot of selling in the Aussie dollar. In characteristic fashion, the liquidity on the way down for this currency is often thin and this accelerates the down thrusts.
AUD/USD broke way below my initial target of $1.0775 laid out here earlier this week, and the next two retracement targets, while the commodity/risk on players run for cover, are indicated on the 240-minute chart below.
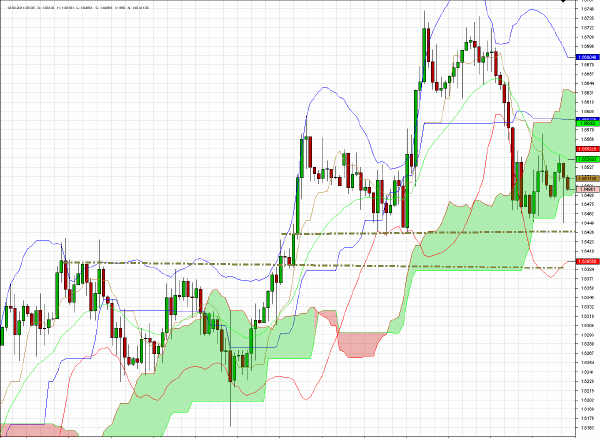
Sterling has been in decline during European trading this morning and the inaction by both the BOE and the ECB suggests, to me at least, that the key zone between $1.6420 and $1.6380 is now in play.
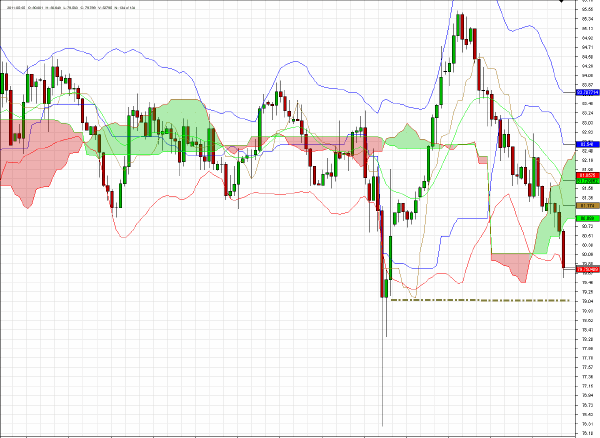
USD/JPY has fallen below the 80 level, raising some possibility of central bank intervention but the underlying message from the chart is that the unwinding of some FX carry positions is accompanying the retreat from risk.
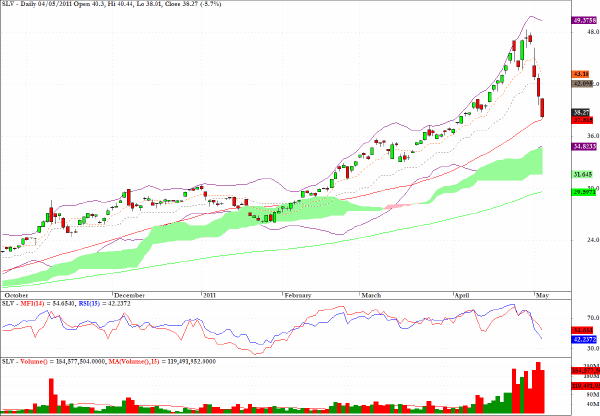
The bloodbath in silver continues as there has been a complete evaporation of bids in the last few sessions.
SLV closed yesterday’s session in the vicinity of $38 but the spot market has broken down further into the $37 zone in trading since the ETF closed trading yesterday. However, I would stand by my target from earlier this week, and even though I would certainly not be a buyer I would exit all short positions for the time being.
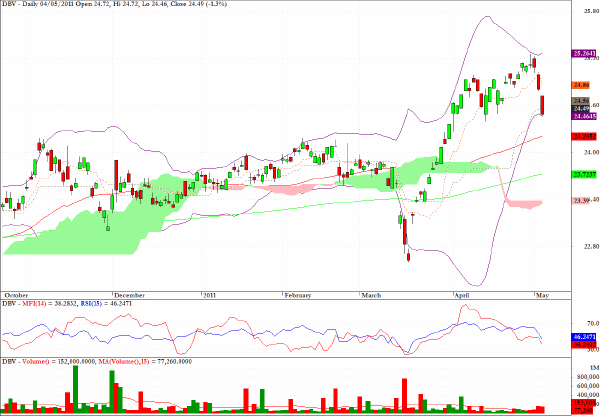
Yesterday’s comment on DBV is worth repeating:
DBV, which acts as an ETF proxy for the FX carry trade, appears to have stalled at the top of its rebound from the Japanese selling climax in late March.
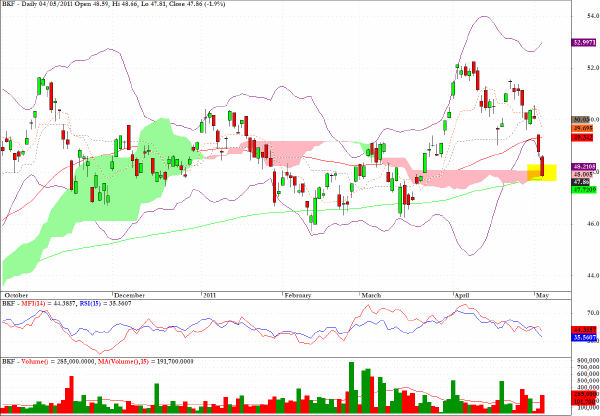
BKF, one of the main sector funds which track the BRIC economies, could find some support from both the 200-day EMA as well as the cloud formation. Also evident on the MFI chart is the distribution which has been taking place in the EM asset class over the last few weeks.
RSX, an exchange traded vehicle providing exposure to Russian equities, is falling along with the energy complex and the 200-day EMA would seem to be a feasible target.
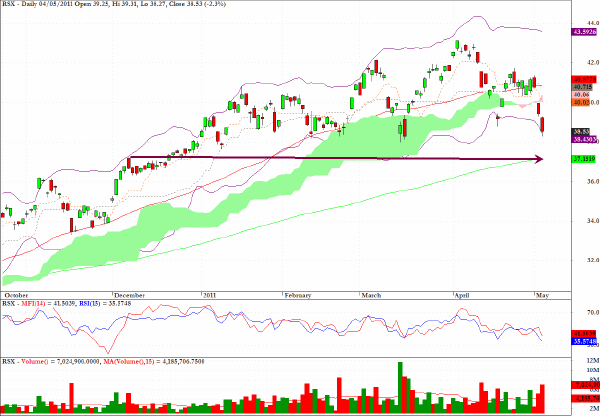
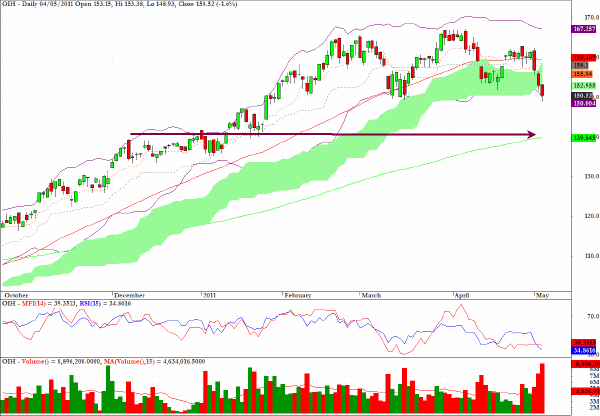
OIH, one of several exchange traded funds in the energy related field, looks vulnerable - perhaps down to the level indicated by the arrow on the chart.
Thursday’s European session has revealed several clear manifestations that risk aversion is now uppermost for many fund managers. Commodities are getting sold across the board as well as the commodity currencies.
An anticipation of this can be found in this comment from Tuesday’s column.
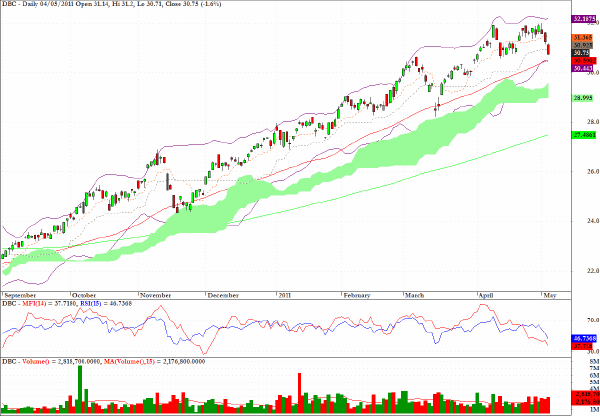
DBC, a sector fund tracking overall commodity prices, is revealing some negative MFI and RSI divergences.
Clive Corcoran is the publisher of TradeWithForm.com, which provides daily analysis and commentary on the US stock market.
|