| Corcoran Technical Trading Patterns For May 9 |
| By Clive Corcoran |
Published
05/9/2011
|
Currency , Stocks
|
Unrated
|
|
|
|
Corcoran Technical Trading Patterns For May 9
Among the many contributory factors to last week’s massive liquidation of long positions in many commodities was an accompanying unwinding of many of the FX pairs which are supportive of risk on positioning. The Australian dollar succumbed to the selling pressure which was becoming evident on the charts after achieving a key objective of peeking above $1.10, the yen strengthened, and on Friday afternoon there were rumors that Greece might be contemplating an exit from the Eurozone.
Whether or not these rumors amount to anything - and they just might - the reaction for EUR/USD and other key cross rates was to add further to the plunge instigated by J.C. Trichet’s less vigilant remarks after Thursday’s ECB rate decision.
Silver was an accident waiting to happen and I would still stay away from that metal. Gold could be a better bet but there is a short-term bear flag developing on the spot chart for the precious metal. The commodity which suffered one of its worst trading weeks in many years was crude oil.
While there would seem to be a capacity for a bounce in crude - and OIL, the exchange traded fund could be a useful vehicle - my suspicion is that the primary beneficiary from improved "sentiment" based on less influence from the raw materials inflationistas will be equity markets.
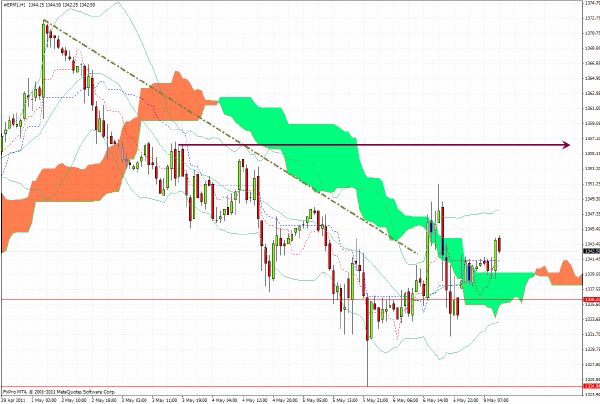
The hourly chart below for the S&P 500 futures shows that a downtrend line has been pierced and targets back in the mid 1350’s seem feasible in the near term.
I am very pleased to have been invited as a guest speaker to the China FX Forum to be held in Beijing this Thursday.
As I shall be travelling during the rest of this week, the next Daily Form commentary will not appear until early next week.

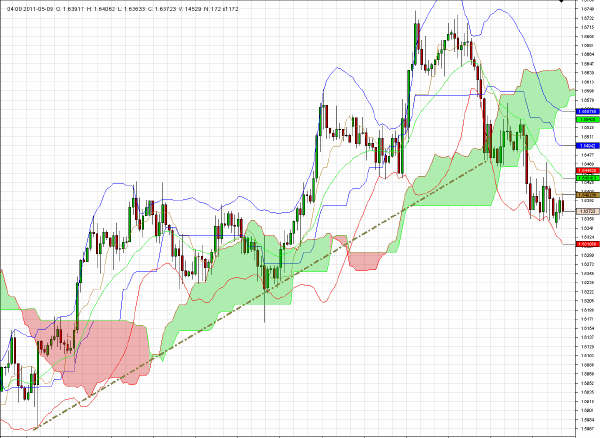
When I last wrote about GBP/USD last Thursday - right after the BOE and ECB rate decisions - the current prize zone was targeted.
Sterling has been in decline during European trading this morning and the inaction by both the BOE and the ECB suggests, to me at least, that the key zone between $1.6420 and $1.6380 is now in play.
The current level around $1.6380 is a pivotal one for sterling, and it was the breakthrough the current zone which propelled GBP/USD to higher levels towards 1.70.
To a large extent the near-term direction of sterling will be influenced by the trajectory of the euro - which still remains in an uptrend on the daily chart but where a failure of the key $1.4240 level for the EZ currency could assist in knocking out the support for sterling.
As always, the relative "strength" of both the euro and sterling speaks volumes about persistent US dollar weakness, as it is only that which is enabling both European currencies to hang on to their relatively positive patterns against the US currency despite their own domestic issues which would suggest lower values.
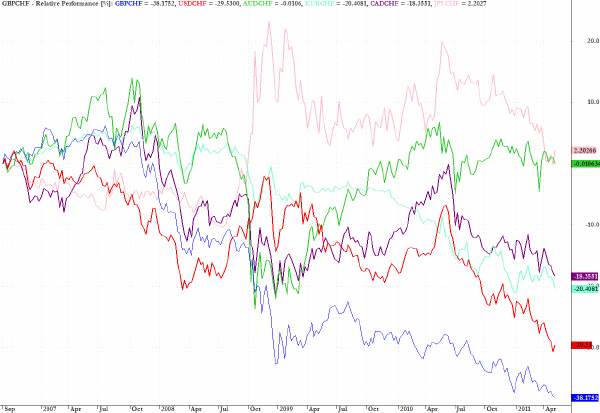
Indeed GBP and EUR are not faring so well as can be seen in the comparative chart with the Swiss franc below.

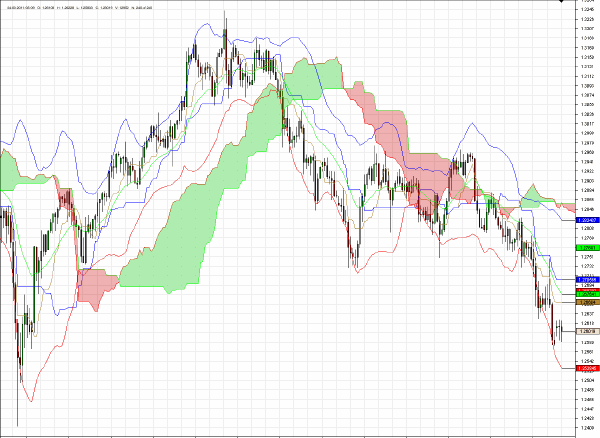
Regular readers of this column will recall that I have maintained a long-term positional play where I remain short the euro against the Swiss franc.
The news on Friday and the ongoing problems facing the peripheral EZ states are not going to be solved any time soon and the 1.25 level looks attainable again, at which point I may lighten up the position somewhat and wait for another move up in the euro towards 1.28 before re-instigating additional short positions.

Measuring the relative strength of various currency pairs can be done using a separate benchmark such as determining the price of gold for each currency, and then creating an index to see how much more or less the gold price in that currency is now rather than it was priced at the base period for the index.
The method chosen to prepare the chart above is simply to contrast the current relative performance of six major currency pairs - each with the Swiss Franc as the base currency. The starting period chosen is the end of July 2007 which marked an important inflection point for most FX pairs.
The results clearly show that GBP/CHF is the weakest pair, and as of the Friday May 6 closing price, sterling is 38% less valuable against the Swiss Franc than it was at the end of July 2007.
The other results are as follows, in descending order:
JPYCHF is up by 2%
AUDCHF is more or less at par
CADCHF is down 18%
EURCHF is down 20%
USDCHF is down 30%
The strength of the yen underlines the peculiar position that the Japanese yen occupies in the FX market - both as a key component of the FX carry trade, and, less now than a few months ago, indicative of the yen’s traditional relative safe haven status even vis a vis the Swiss franc.
Of the key commodity currencies the Australian dollar has more or less retained its position at par value, while the Canadian dollar has performed more or less in line with the euro, as both have declined by similar amounts of approximately 20%.
The US dollar has declined by 30 % but the wooden spoon clearly goes to sterling.
Unsurprisingly, the notable under-performance of GBP/CHF, and the associated lack of purchasing power of sterling, is manifesting itself in higher domestic inflation in the UK.
What is perhaps more remarkable is that yields on 10-year gilts are still relatively similar to those on 10-year bunds and 10-year UST’s, indicating that global asset allocators are not demanding much of a risk premium for holding obligations in, by far, the weakest of the major currencies.

Clive Corcoran is the publisher of TradeWithForm.com, which provides daily analysis and commentary on the US stock market.
|