| Corcoran Technical Trading Patterns For May 23 |
| By Clive Corcoran |
Published
05/23/2011
|
Stocks , Currency
|
Unrated
|
|
|
|
Corcoran Technical Trading Patterns For May 23
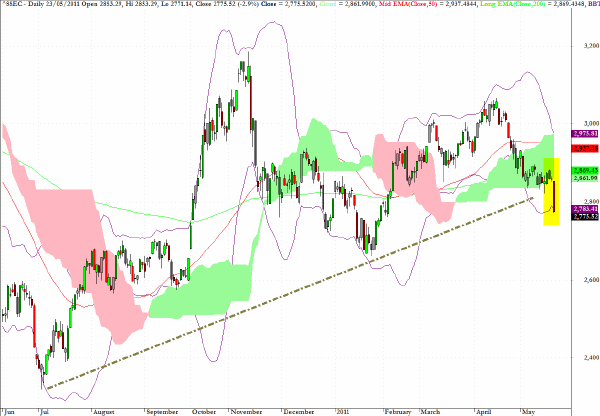
The Shanghai Composite closed Monday’s session with a drop of almost three percent.
The technical picture, as seen on the daily chart below, shows that the index is hanging on by its fingertips to a fairly critical level around 2770. The following characteristics are all pointing to the critical levels that lie ahead.
The uptrend line through lows over the last several months is now in danger of being violated.
Today’s candlestick was a red trend day with the open at the high for the session and a failure to break back into the cloud formation
The close for today’s session has broken below the 20-day Bollinger Band which has been drawn with the bands set at 2.5 standard deviations from the mean. The probability of this happening is approximately 2%.
The last point suggests that a short-term bounce could arise in the next couple of sessions but the clear exit from the green cloud formation suggests that this index will be definitely struggling to regain positive momentum in the intermediate term.
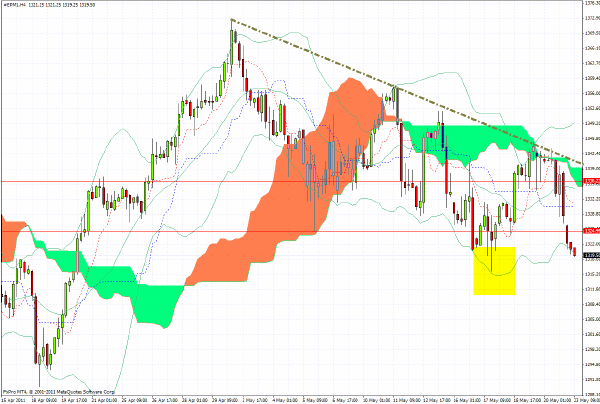
The S&P 500 futures are sliding as a clear risk off mood has been evident in Asian trading and is setting the tone as European traders in FX are pressuring the euro and commodity currencies.
The 240-minute chart suggests that if 1315 which has been highlighted is taken out -- which seems highly probable - then the bears will be targeting a test of the 1290 in the near term.
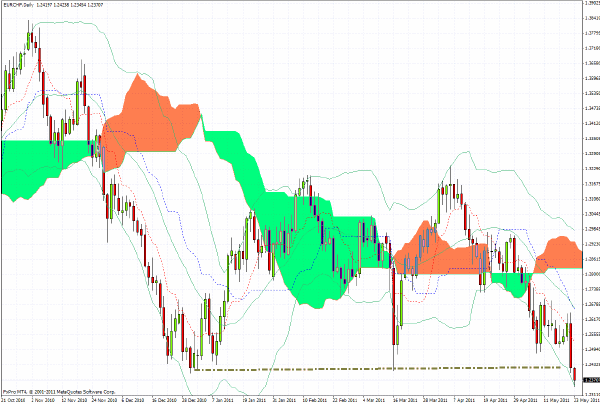
EUR/CHF has broken decisively below 1.24 and at the time of writing is now at a new historic low around 1.2350.
While much focus will be on the EUR/USD rate - which at the time of writing looks ready to break below $1.40 - the attrition in the euro against the Swiss franc underlines the fact that the smart money in Europe is exiting the single currency in droves.
On the subject of the highly unstable situation with regard to sovereign debts of EZ states and the uncertainties posed by the demise of Dominique Strauss-Kahn, readers may find the following article on the selection procedure for electing a new IMF head worth a look. The article also contains some comments on the lack of a coherent strategy (at least so far) from the BRIC nations, especially China, to use the election process as a way of addressing the outmoded nature of the IMF’s voting structure.
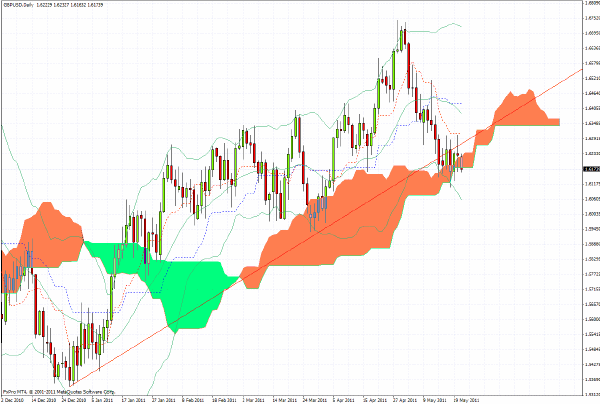
GBP/USD has had a 1.6 handle for most of this calendar year, but the likelihood of a drop back into the 1.50’s is increasing as the dollar is gaining a bid in the midst of the troubled state of the EZ.
My forecast for this week’s range would be $1.6280 on the upside where I would want to be a seller and $1.5850 on the downside where I would be prepared to nibble on the long side.
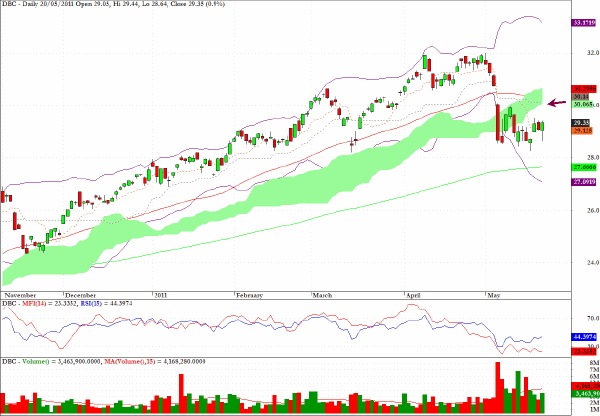
DBC, a sector fund tracking overall commodity prices, shows that bearish flag/pullback patterns are in evidence which translates into an overall trading stance of seeing all rallies as opportunities to build new short positions.
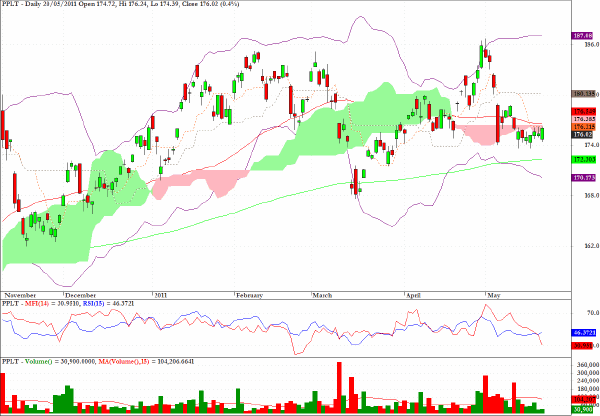
PPLT, an exchange traded for platinum, is another candidate where aggressive hedge funds will tend to see any strength from rallies as opportunities to either unload existing long positions or initiate new short positions.
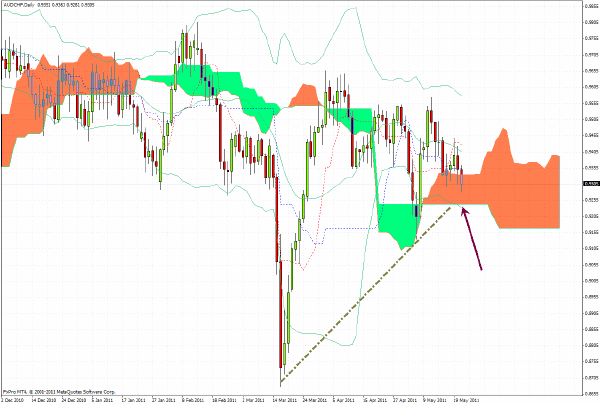
AUD/CHF, often discussed in this commentary as a useful barometer of macro risk, seems destined to test the level indicated by the arrow on the chart during the course of this week.
Clive Corcoran is the publisher of TradeWithForm.com, which provides daily analysis and commentary on the US stock market.
|