NASDAQ Commentary
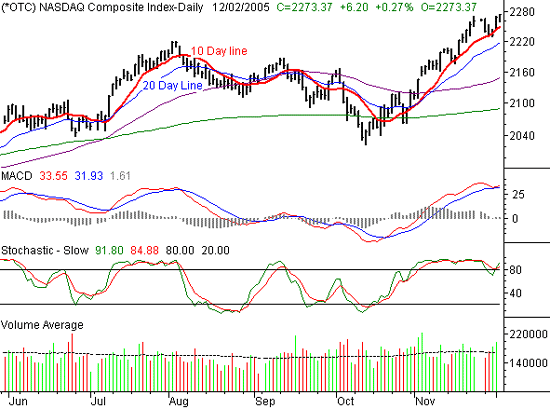
Despite a terrible start, the NASDAQ Composite managed to scrape out a gain for the week. Bouncing up and off of Wednesday's low of 2230.19, the index ended the week at 2273.37. That's a 10.36 point (or 0.45 percent) improvement over the previous Friday. The NASDAQ, however, was the only index capable of coming out in the black for the week. And even though we saw a gain here, it's not all sunshine and roses for the composite.
Friday's high of 2273.61was actually a new 52-week high as well, so in terms of momentum, things look rather bullish. Lending itself to that argument is the sharp bounce we made on Thursday after closing right at the 10 day line on Wednesday. That wasn't unlike the bounce at the 10 day average we saw in mid-November either. So, the buyers are quick to step up to the plate when things start to sink.
But what is different now is the fact the the trend is running out of steam. Momentum is slowing down, and if that problem persists, the market will do the same pretty soon. Additionally, we're bearish in that both the MACD and the stochastics indicators came very close to clinching key sell signals. Both of those potential signals were thwarted with Thursday's rally, but both tools are also still just a hair away from setting up those same sell signals very soon.
With that, we'll just advise caution here....the NASDAQ is vulnerable to a small degree. As we've been saying, we don't expect any vulnerability to extend beyond the 20 day average, currently near 2220. That could still mean a 50 point pullback though. We'll have to wait and see about anything beyond that. Stocks have been led higher (on weekly charts) by the NASDAQ, which is typical of prolonged bullish trends.
NASDAQ Chart - Daily

S&P 500 Commentary
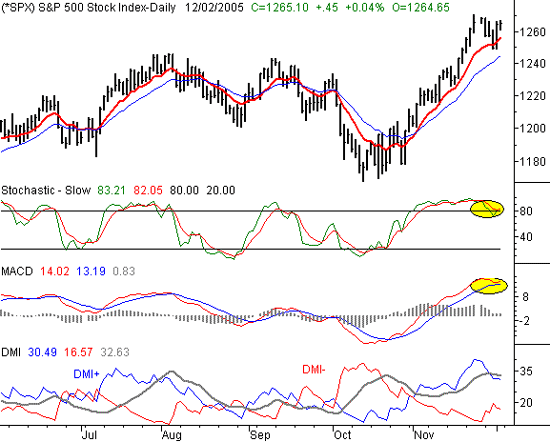
The S&P 500's close at 1265.10 was the first weekly loss we've seen in a long time. Even then, it wasn't a major one......only 3.15 points (or -0.25 percent). However, a longer look at the chart does bring up some concerns for the bulls. Had it not been for Thursday, the SPX would really be in the hole for the week, and more bearishly, under the critical 10 day moving average.
Like the NASDAQ, the S&P 500 was on the verge of some major sell signals just before Thursday's rally staved them off. However, some of the technical damage that was done on Monday and Tuesday still hasn't been undone. We're just one bad selloff away from a MACD crossunder as well as a stochastics crossunder. And if traders come back from this weekend in the same selling mood they were in this past Monday, that may be just enough to break the proverbial camel's back. But like the NASDAQ, we're using the 10 day average as our final proxy. It's currently at 1256....just 9 points away from where the index ended the week.
But in weekly terms, we've already made a significant beariash pattern. That is, a lower high (under last week's peak of 1270.65, a lower low, and a lower close. That may not be as fully bearish as all the short-sellers would like, but that's a far cry from bullishness. Given that we're still well overbought, we're looking for at least more of the same from the S&P 500. That means we could see a period of consolidation or mild bearishness over the next week or so. That will give the 20 day average a chance to catch up to the index, and either provide support, or not. The 50 day line (not shown on our chart) at 1220 may be the more important support line for this index.
S&P 500 Chart - Daily

Dow Jones Industrial Average Commentary
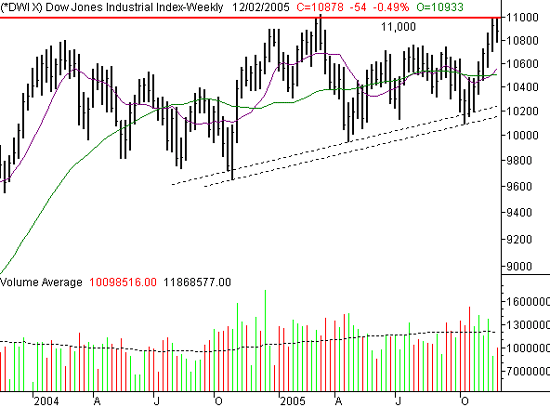
The resistance at 11,000 did indeed become a problem for the uptrend this week for the Dow. The blue-chip index gave up 54 points (-0.5 percent) to close out the week at 10,878. That was the worst loss taken by any of the major indexes.
From here, we expect to see the Dow follow suit and give up a little ground while investors collect their thoughts for a few days. That should give the 50 and 200 day lines a little more time to move higher from their current levels of 10,556 and 10,500 (respectively). We don't think the Dow will sink much further than that. On the flipside, given that we've seen it happen twice, the Dow isn't a compelling bullish trade until that barrier at 11,000 is broken. And with the forecast for more near-term choppiness, that means the Dow could remain stuck in a pretty tight range over the next several days.
Dow Jones Industrial Average Chart - Weekly

Price Headley is the founder and chief analyst of BigTrends.com.