| Corcoran Technical Trading Patterns For May 24 |
| By Clive Corcoran |
Published
05/24/2011
|
Currency , Stocks
|
Unrated
|
|
|
|
Corcoran Technical Trading Patterns For May 24
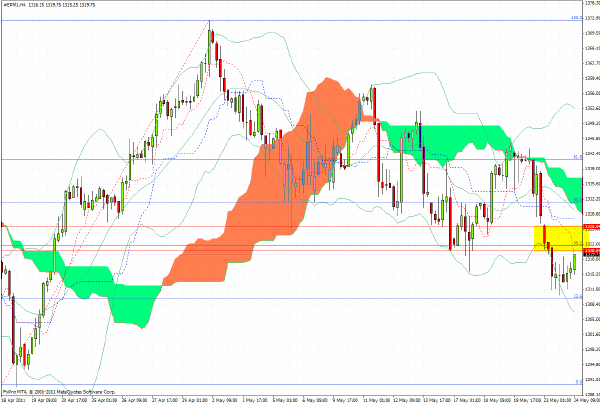
Using a fibonacci grid overlaid on the 240-minute chart for the S&P 500 futures (June e-Mini) the selloff yesterday reached down to the 23.8% level measured off the low seen on the chart below. Technically the case could be made that we should now go back and retest the 38% level which is in the vicinity of 1322.
Given that the masters of market timing, Goldman Sachs, are now telling clients that the commodities correction is over I would even expect 1325 on the futures to be tested again soon - quite possibly today.
However, as indicated on the chart, the highlighted area between 1320 and 1325 is likely to be choppy and only suited for scalpers. While bad economic news has been good news for equities for the last 2 years, as Chairman Bernanke remains super accommodative, the risks from another financial accident in the Eurozone remain high, so outright long positions in US equities are not on my agenda for the time being.

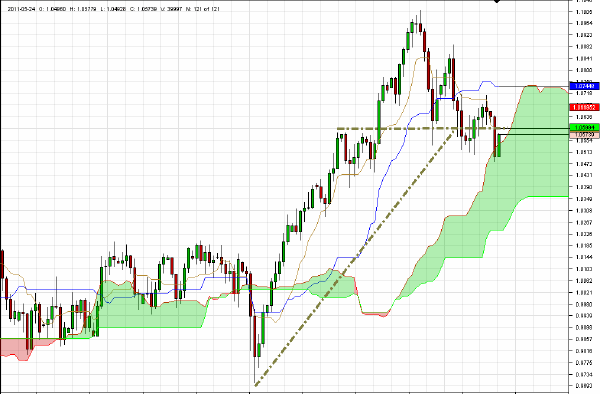
Related to the positive call on commodities one has to take a good look at AUD/USD and as the daily chart indicates the Australian dollar reached a fairly critical level during yesterday’s session.
The fact that we have bounced off the cloud suggests that a short-term rally may be ahead, but longer term the violation of the sloping trend line on the chart suggests to me that the $1.0340 level will need to be tested.

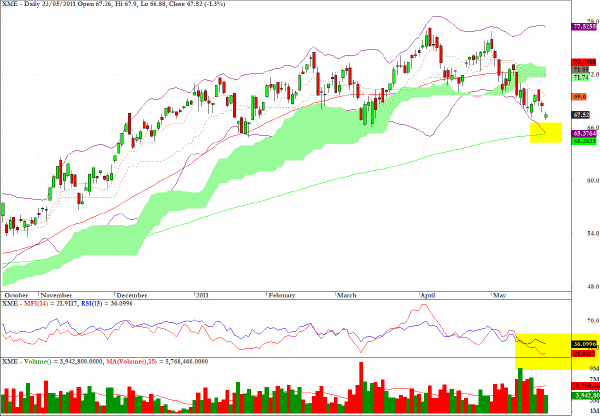
Given the acumen of the GS prop trading desk it may well be time to look at XME which is reaching an area of chart support and appears to be washed out from an MFI perspective.

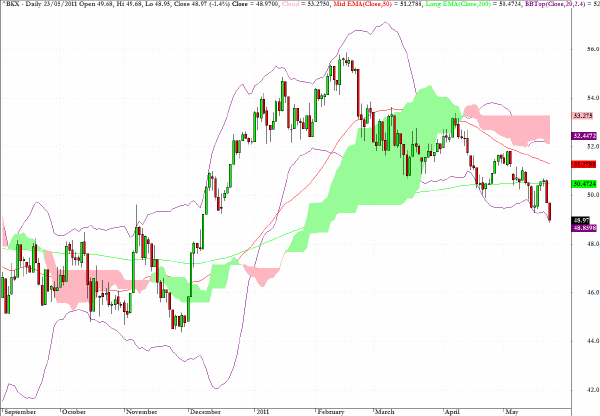
The US banking stocks - as represented by the KBW Banking index - have reached an area of probable chart support and one way to gain exposure on the long side to this sector is through KBE, the ETF which tracks the sector.
However I would not be looking at maintaining a long-term position here, but rather a revisit to the 50-day EMA as it is descending to converge with the 200-day EMA. If the sector fails to perform well in coming weeks - which is the way it looks likely to unfold - this would suggest that the troubles within the US and global banking sector are likely to move into the foreground again this summer.

Clive Corcoran is the publisher of TradeWithForm.com, which provides daily analysis and commentary on the US stock market.
|