| Corcoran Technical Trading Patterns For June 2 |
| By Clive Corcoran |
Published
06/2/2011
|
Stocks
|
Unrated
|
|
|
|
Corcoran Technical Trading Patterns For June 2
Yesterday’s trading, after the release of the ADP data and other signs that the US economy is far from exhibiting any dynamism, did not bode well for the Risk On funds and trading desks. Having said that some of the more agile have learned to turn on a dime, and in the highly correlated markets that presently exist, it became obvious to short all of the usual suspects and seek out the safe harbor of UST’s.
Was enough damage done yesterday to turn the tide against equity bulls? I personally doubt it. The simple fact is that yields on UST’s are not going to supply the kind of returns that will produce healthy fees for hedge fund managers, and risk has to be embraced. While the Fed remains the ultimate back stop there is still reason to believe that bad economic news, courtesy of Chairman Bernanke, will see that the seemingly unstoppable expansion of public balance sheets will lead to such abundant liquidity eventually pushing equities higher.
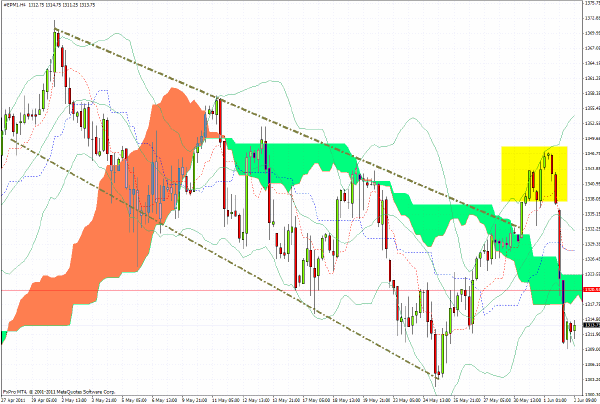
The 240-minute chart for the S&P 500 futures shows - now with the benefit of hindsight - the phoney breakout from the descending channel which occurred while the US was commemorating Memorial Day. The late rally in Tuesday’s session strongly suggests that some trading desks were moving prices up for better short entries in anticipation of the release of key data in the latter part of this week.
In my estimation there is mounting evidence that the world economy is slowing down and there is a distinct possibility that there could be negative growth (to use the ironic oxymoron) ahead for some markets - especially in Europe. However with fiscal gridlock, not only in the US but in many of the "advanced" economies, the only lever that governments have to prop up asset prices is to keep expanding their public balance sheets, and until the bond markets cannot digest any more paper (not likely while the Fed, BOE and ECB keep buying the stuff) then equities should avoid the plunges which are more typically seen when monetary policy is less accommodating.
Having said that, and as if to underline the bipolarity which characterizes the new normal in investing, I would prefer to sell rallies in equities rather than hold long positions overnight!

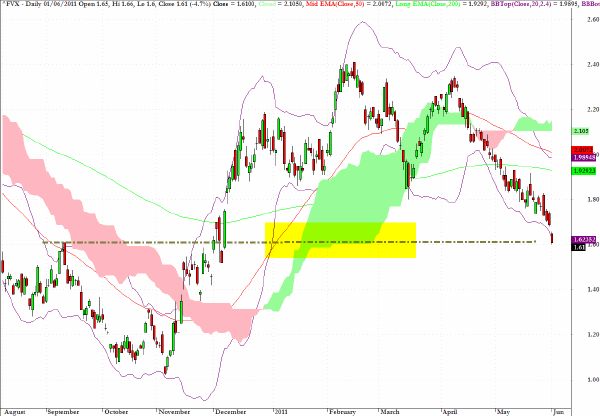
The yield on the five-year UST has come down to a key technical level where, absent some Armageddon event such as the collapse of the euro (just joking), then one would expect to see a bounce up in yields. Especially notable on the chart is the cloud formation and the horizontal trend line coinciding at the 1.6% level as highlighted in yellow on the chart.
However, as just commented in reference to the S&P 500, I would suggest that expecting higher yields in the near term is more of a scalping opportunity than a positional play.

Using quantitative analysis as a tool for "forecasting" price development can be quite error prone and I readily admit to some miscalculations. For example, last week I suggested that the exchange traded fund, AGG, which tracks corporate investment grade bonds, was showing negative divergences. Well, it is now still showing them but at a quite higher price than last week.
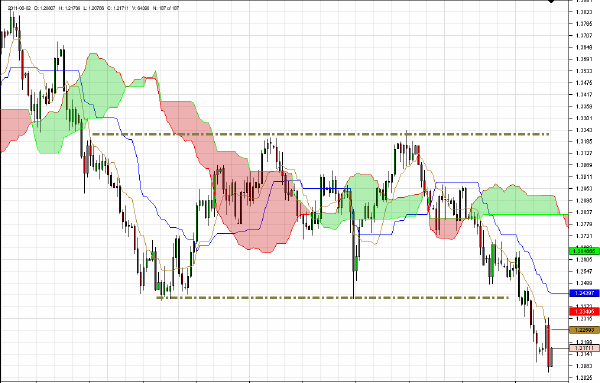
One instrument which I have been consistently right about has been to maintain - as a long term play - a short position in EUR/CHF. This pair has been registering new lows on an almost daily position in recent weeks.
Reviewing the chart I am now taking off most of the position and would expect in the intermediate term to see a test of the lower boundary of the horizontal channel shown on the daily chart.

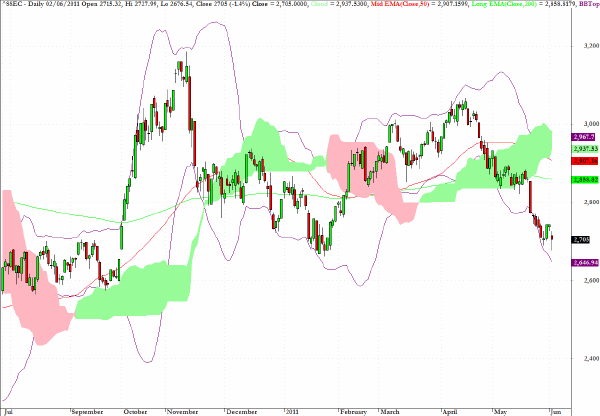
The candlestick registered in Asian trading today (Thursday, June 2) suggests that while the Shanghai market, in harmony with all of the Asian markets, sold off on the poor trading in the US yesterday, the damage was relatively confined.
2700 still seems to be a valid support level and I would be more favorably disposed to a recovery in this market rather than to expect a prolongation of the recent weakness.

Clive Corcoran is the publisher of TradeWithForm.com, which provides daily analysis and commentary on the US stock market.
|