| Corcoran Technical Trading Patterns For June 7 |
| By Clive Corcoran |
Published
06/7/2011
|
Stocks , Currency
|
Unrated
|
|
|
|
Corcoran Technical Trading Patterns For June 7
At the time of writing there are cross currents in the markets I follow which are suggesting that today’s action during the North American session could be erratic and directionless. The euro is continuing its upward trajectory - which in my estimation is largely due to the unwinding of some very large short positions by macro funds built up prior to the new "rescue" of Greece (actually the final nail in coffin in my humble opinion) and yet the US dollar is showing some evidence that it may be finding a bid against other currencies.
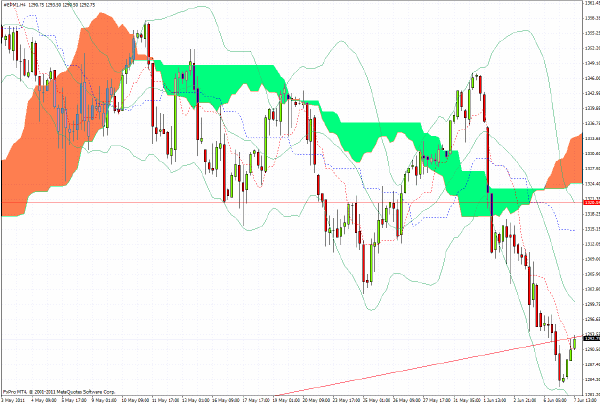
As can be seen on the 240-minute chart for the S&P 500 futures (eMini June contract) the index is trying to rally back above the key trendline which has been violated following Friday’s weak data and a re-appraisal by decision makers on their appetite for risk. Some of the correlation analysis which I do suggests that there are several similarities between those FX/ETF pairs that were registering extreme readings in May 2010 and the data today.
As readers will recall equities sold off last summer and the current macro-risk environment is suggesting that we may be in for a similar episode in the next few weeks. As suggested here last week I continue to favor a trading stance of selling any bouts of enthusiasm for US equities.
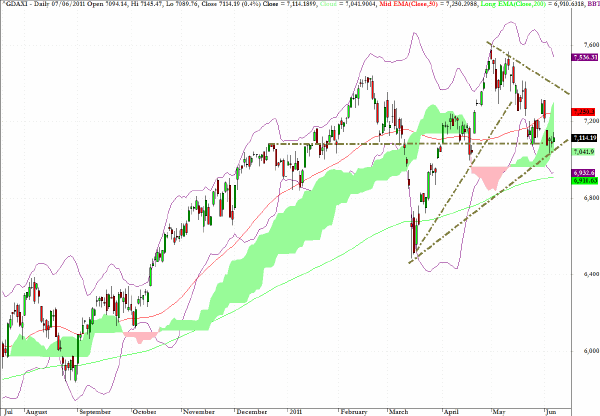
Eurozone retail sales data was released this morning (June 7) and came in quite a bit stronger than expected which created some upward momentum for the DAX.
However, the chart formation suggests that the index will face considerable overhead resistance around the 7350 level.
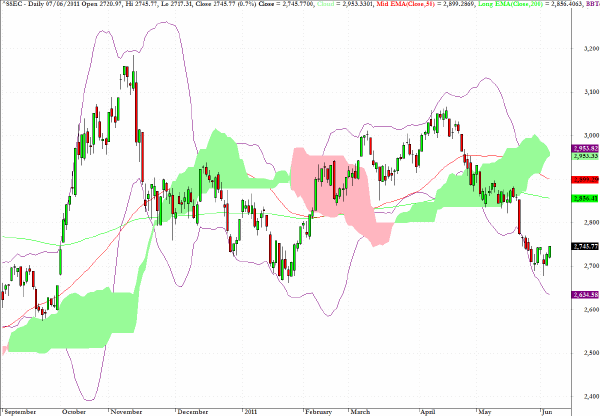
After a holiday in China yesterday the Shanghai exchange once again demonstrated that the 2700 level is a key support level. However this index has a lot of lost ground to make up and the fact that the 50-day EMA is descending down towards the 200-day EMA again is indicative of a lack of sustained commitment to this market by large asset allocators.
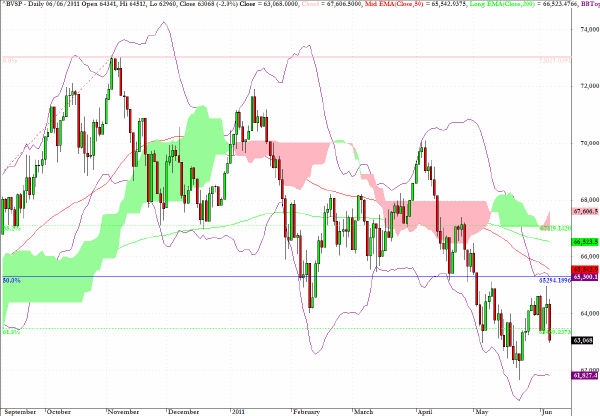
The Brazilian index took a tumble in yesterday’s trading and looks set to re-test the May low.
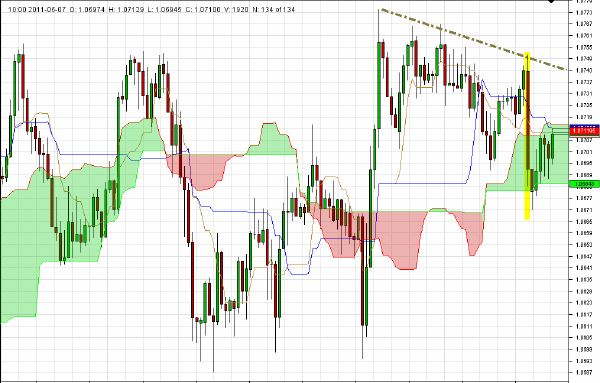
The hourly chart for AUD/USD is pointing to growing resistance in the region of $1.0740 and this is currently my target level for instigating short trades with an intraday scalping horizon
Due to some technical difficulties I was not able to comment yesterday on the market action Friday in the wake of the weak NFP report.
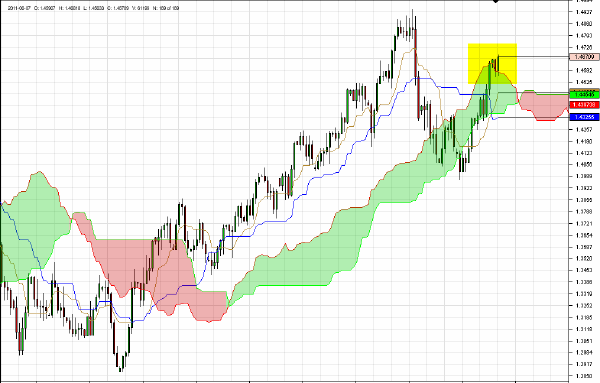
One of the more interesting reactions to the data was the surge in EUR/USD which saw the currency move above the $1.46 level which I had targeted based upon the daily Ichimoku cloud formation seen on the chart below. The euro peeked above the cloud last Friday but came to rest almost exactly at the top around $1.4640. After a drop back into the cloud the currency is now moving higher in what appears to be one more attempt to crack the $1.50 level.
In my estimation the action, as the single currency flirts with this pivotal level in coming sessions, could be a harbinger of what lies in store for risk appetite in coming weeks. If we were to see a successful challenge to this critical level where there is substantial overhead resistance this would point to perhaps a more benign environment for risk assets in general. If however we see another failure - which is more probable in my opinion - the failure could mark an intermediate term top for global equities.
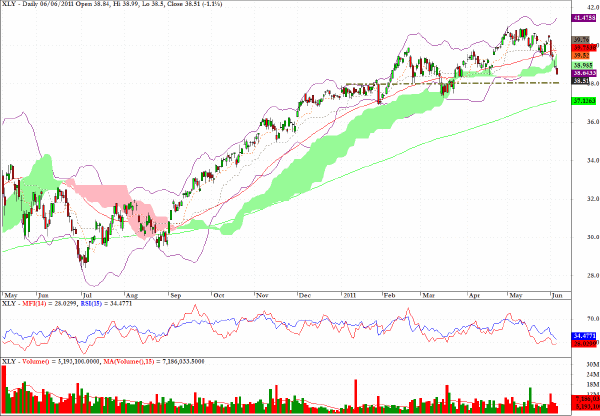
The chart for XLY, the exchange traded fund for the consumer discretionary sector, reveals the "re-thinking" about the vitality of the US consumer sector in the light of Friday’s NFP data.
There is chart support at the $38 level which would act as a deterrent for me to be shorting the sector, although longer term, my intuition is that we are headed lower.
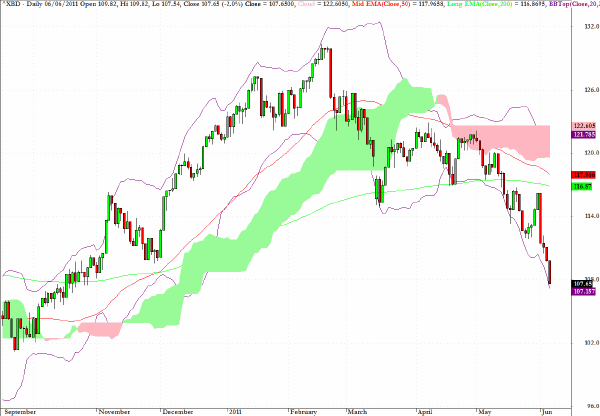
The index for investment banks and brokers, XBD, shows that this key sector in the financial economy is very much out of favor as there are strong headwinds for several of the major firms in the sector - especially Goldman Sachs. I would stay away from the big names in the sector for the time being.
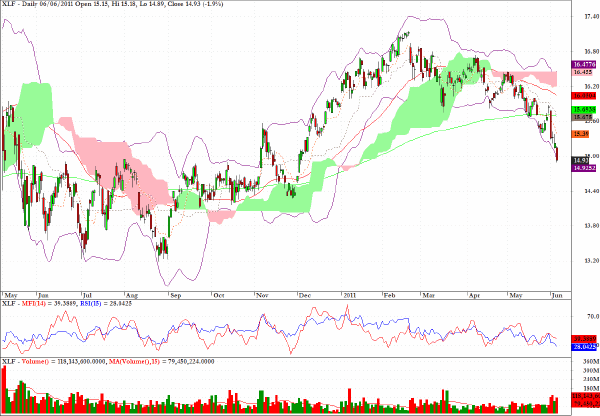
XLF is also showing extended weakness but is approaching a chart level where a snap back rally and buying support could become evident.
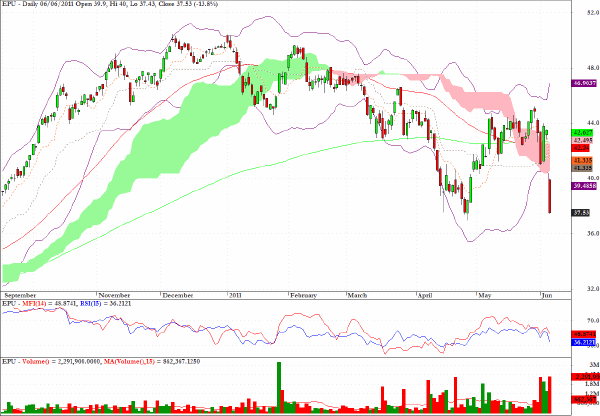
EPU is an exchange traded fund which provides access to Peruvian equities and, the 13% drop yesterday may not be the end of the selling after a socialist president was elected receiving more than 50% of the votes, and dampening the "animal spirits" of some of the EM bulls who had been quietly and steadily building positions in this frontier market.
Clive Corcoran is the publisher of TradeWithForm.com, which provides daily analysis and commentary on the US stock market.
|