Over the past month or so, we've looked at several different charts. Today I'd like to follow up on some of them to note any major changes, or lack thereof. Specifically, I'd like to re-examine oil prices, the dollar, and I'd like to add gold to the mix as well.
Crude Oil
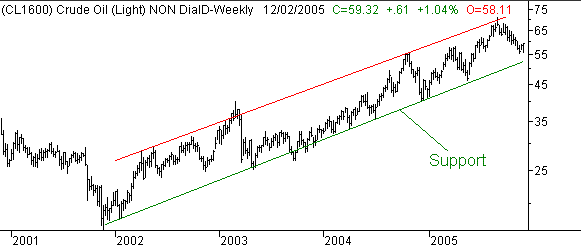
Back on October 25, we first plotted this chart of crude oil prices. Basically, although oil was sliding back from its peak of 70.90, there was a long-term support line positioned to catch prices before they tumbled too far. At the time, that support line was at 52.60, and rising. Now that support line is at 52.90, and of course, still rising. More importantly, the price of crude is still above 52.90. In fact, oil is headed higher again as of Monday. The implication? While we still contend that oil has pretty much hit the high end of its potential range, we're still not out of the woods yet. That support line really needs to be broken before any investor can breathe a sigh of relief that oil prices are under control. Don't misunderstand us - we're not saying that oil prices are back on the rise. We're just saying that crude hasn't started to fall yet. We'll keep an eye on this chart and let you know if and when that support line is broken.
Crude Oil Prices - Weekly

The U.S. Dollar
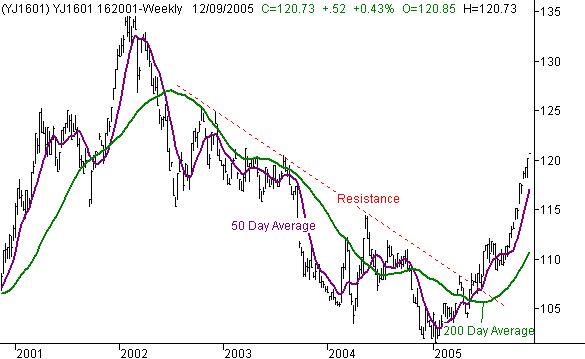
We first went bullish on the dollar back in May, when some key resistance was broken on the dollar/yen (or euro/dollar) chart. There were still some doubters them, but by now, it should be pretty clear that the sawbuck is not in the same rut it had been in for the four prior years. The proof? Results! Let's just look at the conversion rate between the dollar and the yen to see those results.
After hitting a bottom in the 101 area at the beginning of this year, the dollar/yen began what would be the best long-term run we've seen since 2001. The current exchange of 120.73 is the strongest we've seen since early 2003, and there doesn't seem to be any end in sight...........at least not in the long run. In the short run, the dollar looks a little bit overbought, and could be seeing a pullback pretty soon. The 50 day line will probably be the first support area, but if that line falls, we have confidence that the 200 day average will keep the dollar afloat. Those lines are at 117 and 111, respectively. That 200 day line at 110 may seem like it's miles away if this uptrend deteriorates. However, it's practically going straight up. By the time this chart even tested the 200 day average, it could be in the mid-teens. That would be a healthy pullback. (continued after chart)
U.S. Dollar/Japanese Yen - Weekly

Gold
Gold has managed to defy a lot of the odds over the last five years. Treated as a hedge in a bear market, one would expect gold to fall in a bullish environment like the one we've (mostly) been in since 2003. Instead, gold has moved higher. Or, treated as a hedge against inflation, one would expect gold to fall when we were seeing deflation in 2002 and 2002. Again, gold defied the odds. Instead, gold buyers have pretty much seen only the upside potential, and largely ignored the downside. A problem? Well, no, not really.....anybody who was buying gold at any point in the last five years has been well rewarded, despite the external circumstances.
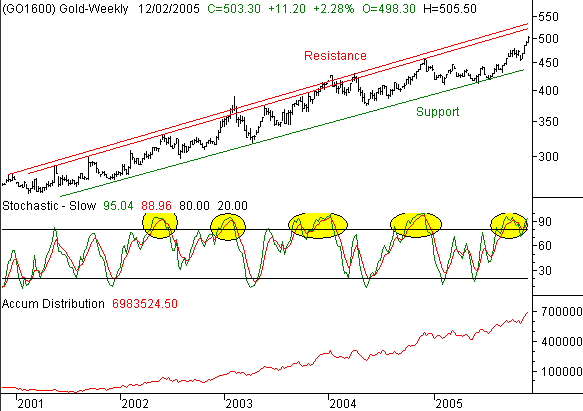
But is it a healthy growth? Stunningly, it is. The rising accumulation-distribution line you see at the bottom of our gold chart below tells as that the volume behind this move has been consistently bullish. And that's the real key - as long as there are buyers, gold will go higher whether it makes sense or not.
So the real question is, how much higher can it go? We hit $505.50-per-ounce last week, which is a major breakthrough.....especially after the market was balking at $400 just a couple of years ago. The answer depends on your timeframe. In the short-term, gold is well overbought. As the chart shows, each time the stochastic lines got above 80, gold prices went into a short-term downtrend. Those pullbacks also were sparked by the price of gold hitting a set of major resistance lines (red). While we're not at resistance just yet, this chart is clearly in an overbought situation.....in the short-term.
In the long run, gold has been guided higher by a strong support line (green). It's currently at 439 and rising. That leaves plenty of room for gold to go through a short-term downturn, and still leave the long-term uptrend intact.
A couple of years ago we would have been hesitant to say that gold can move higher indefinitely. However, the charts don't lie. As long as that support line holds, gold could indeed hit $1000/ounce in the foreseeable future. That said, we'd still keep an eye on this chart, and we'd take any breakdown of support at face value (which is bearishly). The other reason we're still at least a little skeptical about gold going any further than here is the way that gold is being marketed to the masses. Television and radio ads touting the potential of gold are rampant, and they're not even targeting investors or speculators. Instead, they're targeting anyone who may have a few extra bucks to buy gold coins, or anyone who's willing to "write or call for "more information about opportunities in gold". Experience has shown us that once a hot issue has become that much of a household idea, the beginning of the end is near. We'll see.
Gold Spot Prices, with stochastics & accumulation-distribution - Weekly

Price Headley is the founder and chief analyst of BigTrends.com.