NASDAQ Commentary
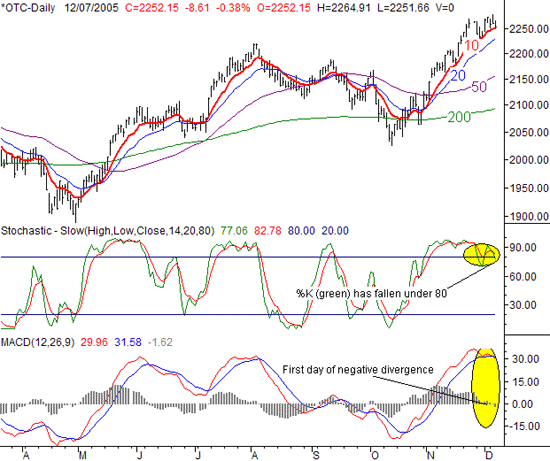
The NASDAQ remains caught between a rock and a hard place, so to speak. The composite is showing us even more signs of a bearish reversal, yet at the same time, is not breaking down under a key moving average - the 10 day line, in red. In fact, over the last few days, we've seen the 10 day average act as support for the NASDAQ. The one thing that is clear, though, is this......the bullish momentum we were seeing two months ago is all but gone.
To be fair and balanced, we have to acknowledge the bullish aspects of the chart. Aside from the fact that the 10 day average is holding the index up, we also have to let you know that the NASDAQ made yet another new 52-week high yesterday when it hit 2278.16. Although it ended up giving most of those intra-day gains back (with even more given up today), that's still a technically bullish event.
On the flipside, the bears have just as many arguments, and maybe even better arguments. One of the key ones is in regards to hitting that new high yesterday......it may not mean as much now as it normally would. Why? We hot new highs for a few days in August, only to see the NASDAQ slide backwards by about 200 points over the next few weeks. We saw the same thing occur in December of last year too. Point being, the 'buy new highs' strategy doesn't work nearly as well as it used to. The 'sell new highs' strategy is just as viable.
And more than that, we almost have two important sell signals in place from the NASDAQ. We say 'almost' because the day isn't over yet, and the NASDAQ could potential find a way to undo those sell patterns. Specifically, we now have a bearish MACD crossunder for the composite. We'd been close to seeing this a few times in the last few days, but could never finish the job. We also have the first half of a stochastic sell signal....again. Remember, for us, the actual stochastic 'sell' occurs when both lines (%K, %D) fall back under 80. The %K line (red) has, but the %D line (blue) hasn't yet. Another day with a lower low and lower close should just about take finish that sell signal though.
So, the critical question remains - will the NASDAQ break under the support at the 10 day average, currently at 2249.60. Until we actually see it, we can't go officially bearish. And even then, we really need to see two closes under the 10 day line to complete the sell pattern. However, based on the change in momentum and the increasingly bearish indicators, we have to anticipate that the support will indeed be broken.
Initially we assumed that the 20 day line would act as support, should the breakdown take shape. It's currently at 2228. However, with the composite being as overbought as it is, the 50 day line (purple) at 2150 may be a more likely landing point. Keep an eye on both.
A break above the recent new high of 2278 would negate any bearish opinion, and set up another rally. However, that rally would also probably be short-lived, as the index would be even more overbought then.
NASDAQ Chart - Daily

S&P 500 Commentary
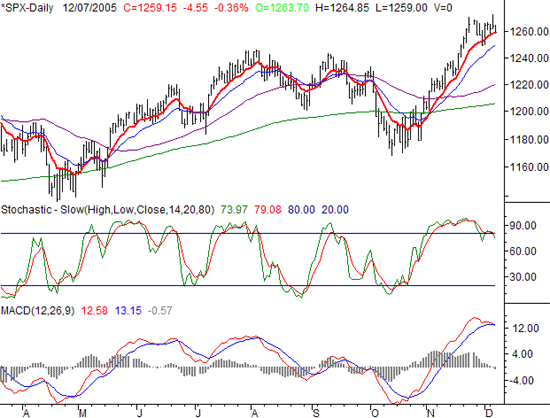
The S&P 500 chart essentially tells the same story as the NASDAQ's a new high (1272.90) on Tuesday, support at the 10 day average (1258.43), and two key indicators at least halfway bearish now....stochastics and MACD. So, we won't get into details here.
The only thing to add is where the likely support levels will be if the 10 day line does break as support. The 20 day line at 1249 was our initial support level. But, now that we're weeks into a strong uptrend, the 20 day line has basically mirrored and matched the 10 day average - it's less than 10 points under it. So now, the 50 day line becomes our target. It's at 1220 and rising, which leaves room for the SPX to fall about 40 points. That would be a about a 3% selloff....nothing extraordinary.
S&P 500 Chart - Daily

Dow Jones Industrials Commentary
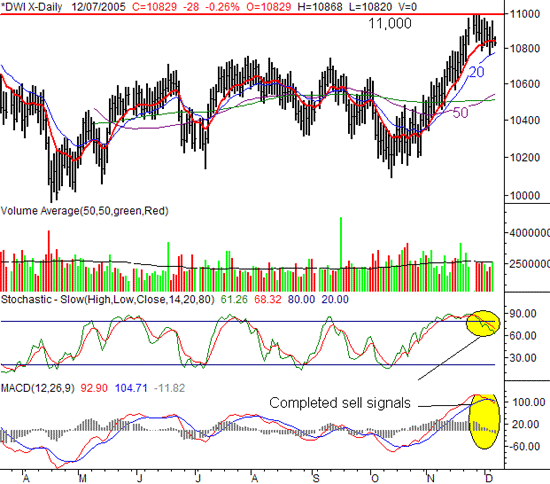
Unlike the other major indexes, the Dow isn't just on the verge of a pullback - the Dow has already locked in a couple of key sell signals. In fact, it's the same two sell signals we were discussing above. That is, we have complete stochastic and MACD sell signals (see chart). We're into the third day of the MACD signal, and about the fourth day of the bearish stochastic sign. And more than that, the Dow's 10 day line has already been broken. The Dow closed under the 10 day average on November 30th for the first time in weeks. Although it hasn't closed under it again since then, it has at least traded under it every day since then. And as of right now, the Dow is indeed on track to close under the 10 day average at 10,844....the Dow is currently at 10,829.
As for where such a dip may lead to, again, it's a toss up between the 20 day average and the 50 day line. The 20 day line was tested as support with Monday's low of 10,818, which helped the average make at least a partial recovery that day. But, with a clear lack of follow through, that may not be enough to inspire ore buyers. The 20 day line is currently at 10,777, so let's put our first checkpoint there. After that (and the more likely reversal point) is the 50 day average, at 10,546.
The resistance above, at 11,000, is a major milestone, and passing it could lead to a monster move higher. We don't expect that to happen before we see a small correction though. A dip to the 50 day average would be about a 2.6% selloff from current levels. That wouldn't be disastrous, obviously, and it might even make for a decent short-term trade. However, we do expect that 11,000 mark to be breached in the foreseeable future.
Dow Jones Industrials Chart - Daily

Price Headley is the founder and chief analyst of BigTrends.com.