NASDAQ Commentary
The NASDAQ Composite finally came back to life on Friday, but it may have been too little, and too late. The index lost 0.73% last week, pulling back by 16.64 points to end at 2256.73. It was the first weekly loss for the NASDAQ in the last eight. But the question is, are we poised for another loss in the coming week? Let's take a look.
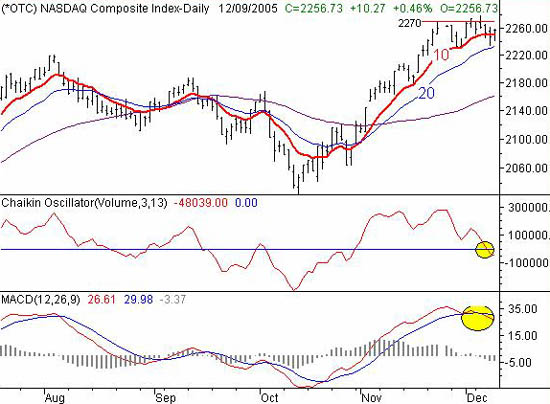
In some regards, the composite's cross back above the 10 day average (red) on Friday is bullish. And to see that cross made the day after the 20 day line (blue) was tested as support makes the 'rebound' scenario even more likely. So from a momentum perspective, things are what they are....the NASDAQ's most recent direction was upward again.
The problem is, nearly every other tool we use is telling us otherwise. For instance, we saw a MACD crossunder (highlighted) several days ago. Since the 6th when we first got that sell signal, the MACD divergence has even widened. The same goes for the Chaikin line. It crossed under zero on Thursday, yielding its official sell signal (also highlighted on the chart). And that really is the key to the market's next move
That leaves the index stuck somewhere in the middle of a tug-of-war. Technical indicators say 'bearish', while the price momentum is slightly bullish.....or at least holding on. For that reason, we're being a little cautious here. We're siding with the technical tools this time around, so we're leaning towards bearishness. HOWEVER, all of that is contingent on what happens at the 20 day average at 2232, if anything. Unless we actually see a close under that line, we can't really justify any new bearish trades based on this chart alone. The reality is that Thursday's deep low may have been enough of a correction to appease nervous traders, after seven weeks of big gains. If they're confident again, don't be surprised to see another buying spree, especially this time of year. In that light, resistance is at 2270. A move past that point could trigger a bullish move.
NASDAQ Chart - Daily

S&P 500 Commentary
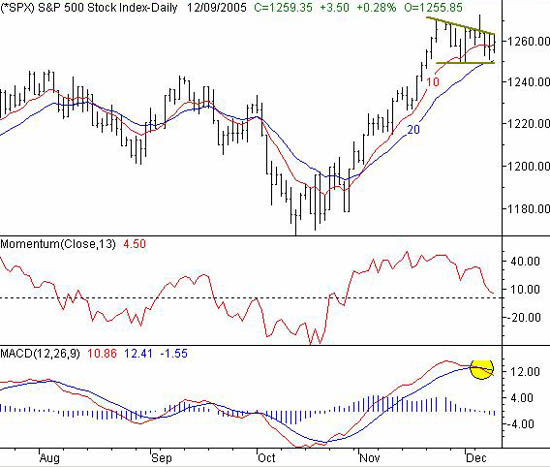
The S&P 500 chart pretty much mirrors the NASDAQ's, in that it managed to alleviate some worries by closing above the 10 day average on Friday, ending the week at 1259.35. But for the week (the bigger picture), the S&P's 5.75 point loss (-0.45%) is still a loss, and it was the second in a row for these large caps. But as with the NASDAQ, the worst of the dip could be over.
Over the last couple of weeks, the SPX has managed to work itself into a pretty well defined trading range (see chart). The bottom edge of that range is the support line at 1250. The top edge of that range was last at 1263, and falling. The only point in time when that upper resistance line was broken was on Tuesday when the index saw a high of 1272.90, but even then, it closed under that top boundary. We'll get back to this range in a second. In the meantime...........
Technical indicators (other than the price) are telling a more bearish story. We have a full bearish MACD crossunder here, and the momentum line is clearly pointed lower. We have to accept these at face value until we have a clear reason not to. So in that light, we're leaning towards short-term bearishness here as well.
Back to the trading range........
Although we're slightly bearish here, the importance of that very tight support/resistance zone can't be understated. Until the S&P 500 actually breaks under 1250 or above 1263, there's not going to be a lot of trade-worthy movement. Once the index finally does break out of that box though, it could be huge. A breakdown under 1250 would also pull the S&P under the 20 day line, and act as a confirming sell signal. If instead the S&P forms a bullish break past 1263, it will have two weeks worth of consolidation to use as fuel. That could mean a major move higher (and it's the right time of year for it).
S&P 500 Chart - Daily

Dow Jones Industrial Average Commentary
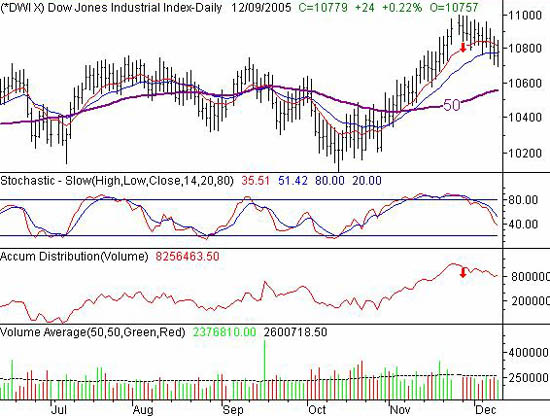
As usual, the Dow was the least impressive of the major indexes, losing 99 points (-0.9%) to close at 10,779. That left the blue-chip index under the 10 day average (at 10,815), and almost under the 20 day average (at 10,774). However, none of that dip can be a surprise - we had bearish MACD and stochastic signals in place several days ago.
Since then, the volume has turned bearish too - and stayed that way. The accumulation-distribution line rolled over at the end of November, and the index behaved accordingly. In fact, the turning points for the A-D line as well as the index itself were basically the same day.....November 28th.
It was a little bit off of our radar as long as the 20 day line was intact as support, but now we have to start looking at the next potential support level. That's the 50 day average, currently at 10,556. Technically speaking, the 20 day line is still support, and will be until we get a close under it. However, based on the direction things are going right now, that support at the 20 day average could be breached as early as Monday.....we traded under it each of the last three days of last week, and each day was successively lower.
Resistance is still at 11,000.
Dow Jones Industrial Average Chart - Weekly

Price Headley is the founder and chief analyst of BigTrends.com.