In our last episode, we examined optimizing according to the return on account. This is a way of contextualizing the net profit. That is, showing how much risk had to be endured to achieve it. It's a more inclusive portrait than merely tweaking the profit alone, and consequently it's my optimization tool of choice.
Recently, however, I've become enamored with the concept of “mega systems” (my term I believe). I see them as intraday methodologies that pack an abundance of trades, usually trying to capitalize on the normal market ebb and flow. You can see a detailed analysis of this in this month's (March 2005) Futures Magazine, in the article entitled, "Trading Around an Idealized Model."
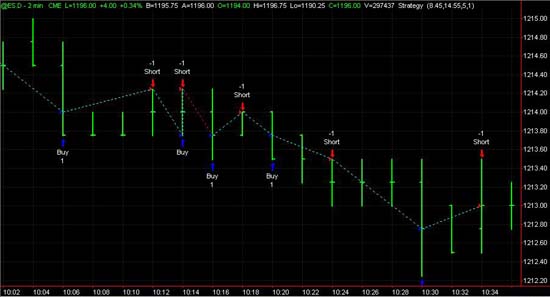
The article shows how logistical realities have kept me from breaking through the mega-trade wall. When trying to buy and sell limit orders off two-minute bars for instance, your main problem is that popular software will show many profitable trades that wouldn't happen in the real world. Any time a buy is merely touched at the low of a bar, the software will consider it filled. Whereas most of the time in actual trading, it won't be. Figure 1 shows numerous buys at the bottom of a bar, sells at the top. Four of the short levels never would have been penetrated before a reverse buy signal occurred.

Click here for a larger image of the above graphic. (A new browser window will open.)
The second problem is the tendency for the average profit per trade to shrink as you pack evermore trades into a given data field. When you're looking to buy and sell every third or fourth two-minute bar, you're likely to be wallowing in figures reflecting fractions of a tick. With added commission cost and occasional slippage (on non-limit stop orders), you're facing a real barrier.
The logistics of the mega-system in question is not the point of this article �" that's a lengthy discussion you can check out in Futures. The aim here is to identify the cat that needs skinning �" the problem of not enough profit per-trade to overcome logistical realities. In that case, average trade net profit is what you'll want to maximize as far as possible before you start figuring how to make additional filters or qualifiers push you into the realm of an actual system.

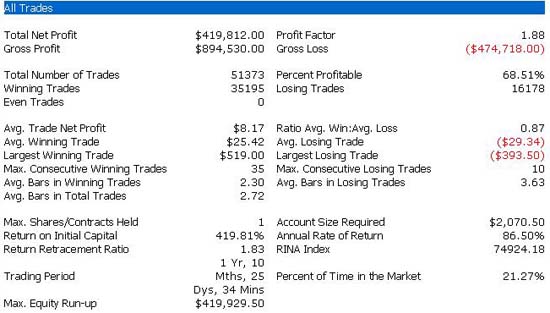
Figure 2 shows the performance summary of trying to buy a five-bar open-to-low average subtracted from a next opening, and vice versa for shorts. It represents 500 days through March 16, 2005, and each trade is docked a $6 commission charge. The dramatic theoretical results explain why I'm (perhaps stubbornly) drawn to this quest. As always, there are many variations on this approach. Some will significantly change the number of trades, the return on account, the net profit, etc. At these mega-trade levels though, the one figure that won't budge much is that $8.17 average trade net profit, and that's where the focus should be. Just the sheer number of trades we're dealing with suggests there's validity in any inch gained.
P.S. I'd love to receive feedback from you. Please leave a comment or discuss the article by clicking on "Make a comment on this article" below.
Art Collins is the author of Market Beaters, a collection of interviews with renowned mechanical traders. He is currently working on a second volume. E-mail Art at artcollins@ameritech.net.