| Will The New Quarter Bring A Market Mood Shift? |
| By Price Headley |
Published
10/3/2011
|
Currency , Futures , Options , Stocks
|
Unrated
|
|
|
|
Will The New Quarter Bring A Market Mood Shift?
How can we describe last week on four words or less? Great start, weak finish. Though we ended up only losing a few points compared to the prior Friday's close, it was enough to cast a shadow of doubt (as if five straight months of losses wasn't enough on its own). On the other hand, there's still a glimmer of hope in the fact that the recent major support levels didn't get taken out.
We'll weigh the odds in a second. First we need to paint the macro-picture with last week's and this week's economic numbers
Economic Calendar
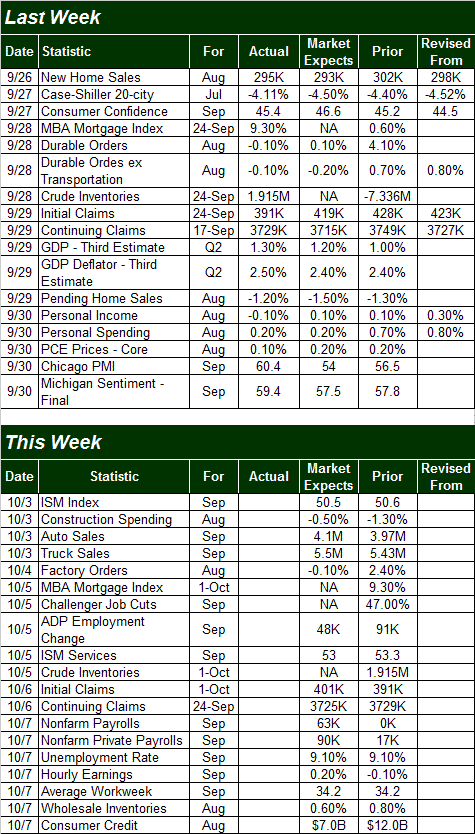
Busy week last week, particularly on the real estate front. It wasn't necessarily a good one though. New home sales fell back to an annual rate of 295K for August, teetering on multi-year record lows again. Pending home sales fell by 1.2% for August as well, while the Case-Shiller Index said home values fell 4.11% for July (the latter somewhat explains the two formers).
Given the weakening state of the consumer though, the continued slide in real estate activity/demand makes sense. Personal income fell by 0.1% in August, while spending only grew by 0.2%; both were well under expectations.
Durable orders also fell, by 0.1%, with or without autos.
It wasn't all gloom and doom though. The prior week's initial unemployment claims fell under a key (even if only mental) 400K mark by rolling in at 391K; the ongoing claims figure held steady at a little over 3.7 million. Both consumer sentiment measures (Michigan Sentiment and the Conference Board's 'consumer confidence') both ticked a little higher last month after hitting multi-month lows a month earlier. And, as it turns out, the second quarter's productivity – as measured by GDP growth – was a better than expected 1.3%.
None of that was inspirational enough, however.
Economic Calendar

The coming week is going to be even busier, particularly on the jobs front.
Things will have kicked off Monday with last month's auto sales figures. Look for a little growth in both cars and trucks sold, though any upside there could be offset by falling construction spending (Monday) and the likely 0.1% slide in Tuesday's factor orders number.
It's not until Wednesday when the fireworks really start, and it's all about jobs, jobs, jobs.
ADP says we only added 48K (net) payrolls in September; while the expected government figure for Friday is an additional 63K new payrolls (nonfarm, and including government workers). The number bumps up to 90K when just looking at the private sector, but it doesn't change the reality…. that's not enough shrink the unemployment rate.
And speaking of, we'll get the official unemployment rate on Friday; look for 9.1% again.
Also on Friday we'll hear about earnings growth and the length of the average workweek, but the newest 'biggie' for the first Friday of the month is new the swelling consumer credit levels. Consumers added a whopping $12 billion in lending capacity in July, and the pros are looking for another $7.0 billion to have been tapped in August. Broadly speaking, between revolving and non-revolving credit growth over the past few months, it's hard to say that a lack if available credit is the culprit for a failing recovery.
S&P 500 Index
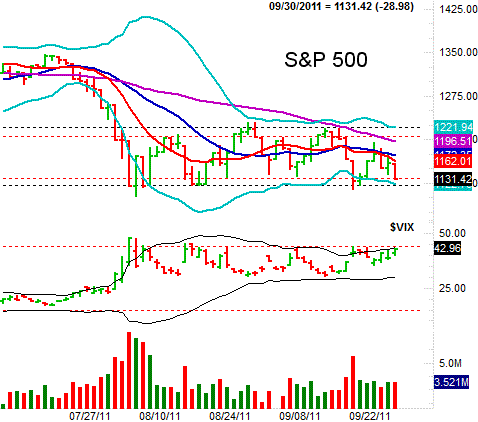
It wouldn't be unfair to say the S&P 500 (SPX) (SPY) is on its last leg. On the flipside, the last leg is still in place, which means we don't want to get presumptuous here.
That 'last leg' is the support at 1120, which was effectively the floor for every dip/pullback since early August. That's also where the lower 20-day Bollinger band is now, adding to the strength of the floor there. The problem is, that lower band line is also pointed lower, which means its support role is minimal at best. And, given that the 10-day (red) and 20-day (blue) moving averages are now playing a resistance role – both blocked last week's rebound effort from the S&P 500 – it's clear the bears have more going for them than the bulls.
Similarly, the CBOE Volatility Index (VIX) (VXX) (VXZ) is knocking on the door of resistance at 43.80. In fact, all of the VIX's tests of 43.80 have coincided with the SPX's tests of support at 1120. (The VIX's upper 20-day Bollinger band is also capping it for the time being.)
If the VIX hits new highs it will likely coincide with the S&P 500 hitting new lows, and vice versa. In other words, one will confirm the other…. and if we see both, it could get ugly for stocks, fast.
SPX & VIX Daily Chart

All that being said, there's a MAJOR footnote to add here.
While the market looked superficially bearish last week, it may not have had a fair shake. It was also the end of a calendar quarter, and with that being the last chance for fund managers and institutional money managers to clean up their portfolios before showing them to their bosses – often called 'window dressing' – before the quarter ended, there's a good chance these folks were just dumping more stuff than the market could absorb.
To be fair, this window dressing action is usually more talk than action…excuses traders make for an unexpected twist in the last few days of any given quarter. This time though, it may have been very, very real. See, this was the fifth straight month of market losses (and would have been anyway with or without any conceivable gain last week). It was also the worst quarter for stocks since 2008. After that kind of drubbing, even the most staunch and stoic of institutional investors is forced into defensive action.
Point being, if there was ever a scenario for a complete 180 degree turnaround in the market's mood and direction simply because we've moved from one quarter to another, this is it. By the time you're reading this, stocks could be soaring. Or, they could be imploding…. a testament to just how unclear things are now, and how uncertain investors are as a result.
Dow Jones Industrials & NASDAQ Composite
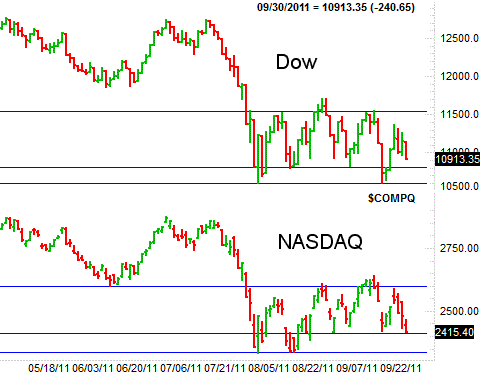
Normally we'd examine a weekly chart of the S&P 500 here just to offer some added perspective. This week though, it didn't add anything meaningful. S o instead, we'll just take a quick look at the other major indices' lines in the sand.
For the Dow (DIA), the floor at 10,814 is still intact, as is the ultimate floor at 10,598. For the NASDAQ, the floor at 2415 is under fire (though still in place), and there's yet another floor at 2335.
Don't misunderstand…. not every index has to hit new lows for the market to tip over. When and if all of them do hit new lows though, there's not a lot that can undo that widespread damage.
Dow Jones Industrials & NASDAQ Comp Charts – Daily

Price Headley is the founder and chief analyst of BigTrends.com.
|
|