| The Wagner Daily ETF Report For November 28 |
| By Deron Wagner |
Published
11/28/2011
|
Stocks
|
Unrated
|
|
|
|
The Wagner Daily ETF Report For November 28
After showing early signs of promise on Friday's holiday shortened session, stocks slid listlessly into the close, as all five major indices closed lower. After being up as much as 0.7% on the session the Nasdaq plunged to close down almost 0.8%. The small-cap Russell 2000 took the biggest hit, as it lost a substantial 1.2%. The S&P MidCap 400, S&P 500 and the Dow Jones Industrial Average dropped 0.4%, 0.3% and 0.2% respectively.
Market internals closed the day mixed. As might be expected on a shortened session, volume dropped across the board. Turnover fell on the Nasdaq by 31.5% and on the NYSE by nearly 24.0%. Declining volume held a slight advantage over advancing volume on the Nasdaq by a factor of 1.5 to 1 on the the NYSE by a factor of 1.4 to 1. Because of the abbreviated session, little useful information could be gleaned from Friday's numbers, other than the market continues to struggle to find a bid.
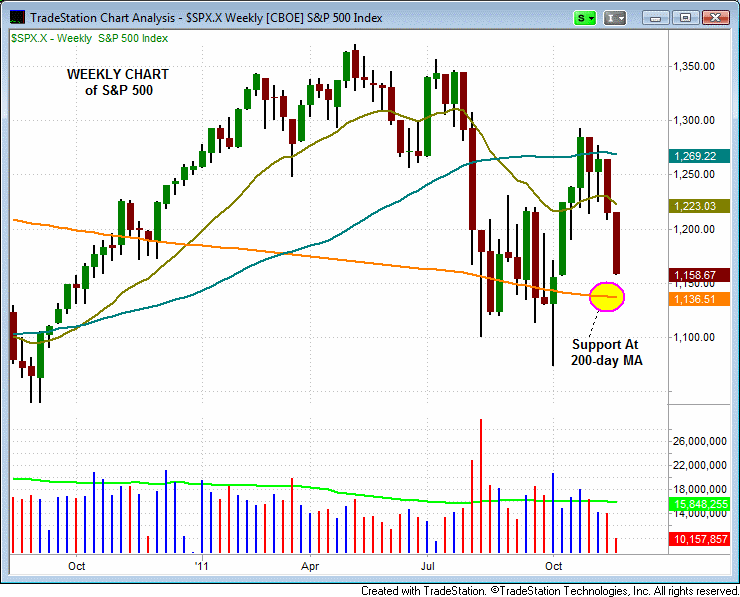
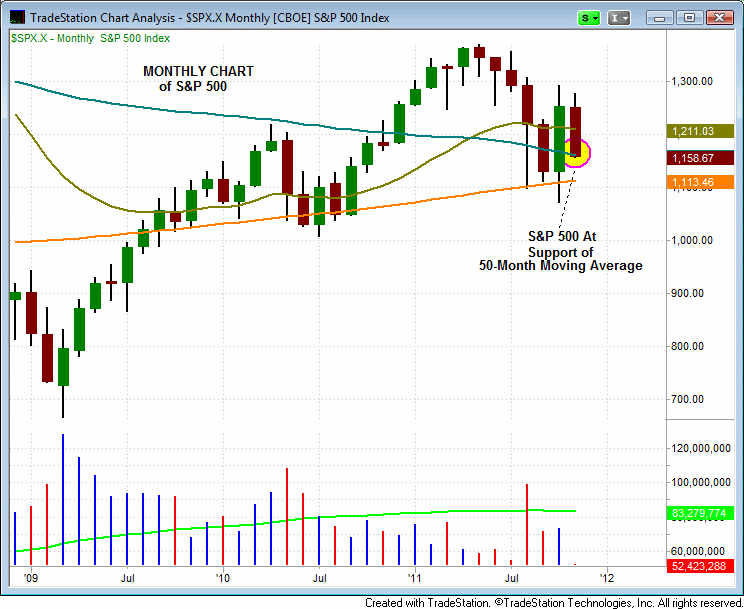
A brief review of the S&P 500 ($SPX.X) across various timeframes provides an interesting perspective as to the market's current structure. The daily chart of the S&P 500 appears to place the index in "no man's land", as the current price action is well below the 20-day and 50-day moving averages, yet well above the 200-day MA. However, it is important to note that an inverted hammer candlestick was formed on the daily chart on Friday. Inverted hammers in and of themselves are not considered reversal candles (or buy signals). However, they are often used as an early warning sign that a downtrend may be reaching exhaustion. Whenever an inverted hammer is observed after a protracted selloff and it does not occur near an easily identifiable support level (on the daily chart), we find it useful to reference both the weekly and monthly charts to gain a better picture of the market structure in terms of support and resistance levels. Notice on the weekly chart that the S&P 500 is rapidly approaching support near the 200-day MA. However, the monthly chart of the S&P provides the most pertinent information, as it shows the index is right at support of its 50-day MA. Combined, this information suggests that caution is warranted on the short side and that it may be advisable to lighten up on short positions and/or wait for a bounce in the market before considering new short entries.

 < <

Although the market has been in a tailspin over the past two weeks, several momentum indicators that we follow suggest that the market may be approaching an oversold level. We would not be surprised to see further selling on Monday but our overnight research is not revealing quality short setups and we are therefore looking to wait for a bounce in the broad market before we consider taking on potential short setups.
Deron Wagner is the Founder and Head Trader of both Morpheus Capital LP, a U.S. hedge fund, and MorpheusTrading.com, a trader education firm.
|