NASDAQ Commentary
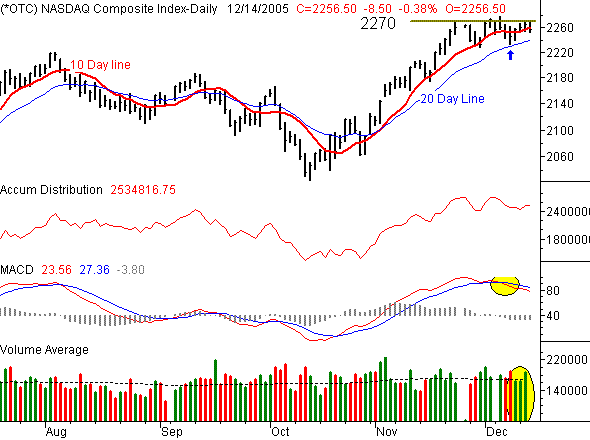
Basically, the NASDAQ is still caught between a rock and a hard place. At the end of last week, it looked like the composite might be able to light the fires again, after bouncing off the 20 day average on Thursday, and following up with a strong Friday. We even had a pretty good start to this week, but today, we find the NASDAQ back under the 10 day moving average. This leaves the index basically where it was at this time three week ago, and it leaves traders a little frustrated.
The line in the sand has become clear over the last three weeks - it's the resistance right around 2270. That's basically been the highest high we've seen in December, with the exception of 2278, reached on the 6th. We would need to at least get above that mark to really get excited about being bullish. On the flipside, we've already seen the 20 day average hold up as support, when the NASDAQ pushed off of it last Thursday with its low of 2233.74. Now that 20 day line is at 2239.62, and still on the rise. We expect to see some support effort there again, if retested.
In the meantime, the composite seems content to be stuck in that rut, between 2240 and 2270. In a prior analysis we had anticipated that the support would be most likely to break, which would allow the NASDAQ to head lower at least a moderate amount. Now, however, it's clear that the buyers are not giving in. We've seen good volume (not great, but good) behind the daily rallies over the last three weeks. That hasn't helped the market a whole lot, as there haven't been enough consecutive accumulation days to make a 'bigger picture' difference. But, we're still seeing consistent buying interest. Eventually, one side or the other will have to yield.....and as of right now, we have to say that the bulls have a little more conviction.
That said, the reality is that we have no technical reason (yet) to make any call - bullish or bearish. We're right in the middle of a tight range, BUT we still have a MACD sell signal, BUT the volume tide is slowly turning bullish. That's just a lot of mixed signals to process. We'll opt for a little more certainty before proceeding, but based on the current chart (which is a little incomplete), we think the rest of the calendar year should be positive. The break above 2270 is the key.
NASDAQ Chart - Daily

S&P 500 Commentary
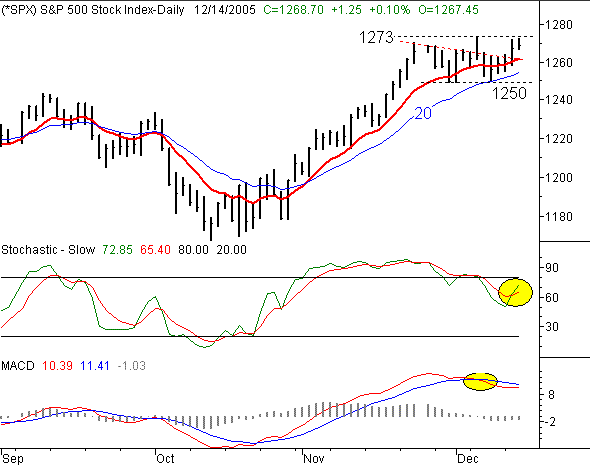
While the jury is still out on the NASDAQ's chart, the S&P 500's chart has actually turned marginally bullish. As with the NASDAQ, Thursday's reversal at the 20 day moving average was the key. After hitting it with its low of 1250.90, the S&P 500 managed to bounce back as high as 1272.50 earlier today. Between then and now the SPX has slipped to 1268, but its still an impressive move for an index that appeared to be stuck in the mud. That high today essentially matches the peak at 1272.90 from last Wednesday. Seeing it hit twice now forces us to plot a resistance line there (see chart). As you may expect, that's the key to any upside forecast - a move and close above that level. Until (and unless) we can actually do that, the S&P is also range-bound.
On the flipside, the technical indicators here are starting to turn bullish, if they haven't already. Specifically, we already have a stochastic buy signal (just a few days after we completed the sell signal). We can also see that the MACD sell signal from several days ago is unwinding. The divergence there is shrinking, and with only a little more strength, we could see a bullish cross made.
That MACD crossover coinciding with a break above 1270 will be the key to an official bullish stance. We don't have it yet, but we think we will sooner than later.
S&P 500 Chart - Daily

Dow Jones Industrials Commentary
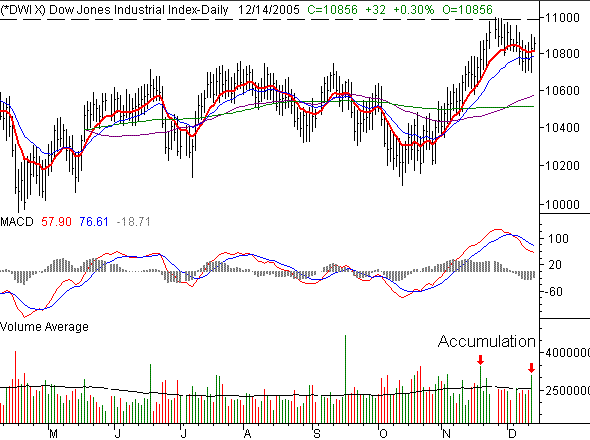
Not a lot to add here - the Dow continues to struggle with getting any traction at all (in any direction). It fell under the 20 day averages for a while last week, where the other indexes found support there. So on a relative basis, the big blue-chips still seem to have the least to offer in the way of bullish opportunities.....despite the fact that they're showing the biggest gains so far today. We chalk that up to the fact that they had the most room for improvement following their significant weakness last week.
The liability for the Dow continues to be the resistance at 11,000. That level represents new 52-week highs for the index, and having been stopped there twice this year, it's a line we have to watch closely. As for support, although we're now back above the 20 day line at 10,786, we still have to mark major support at 10,574, where the 50 day average currently resides.
On a slightly related note, we've seen a couple of major accumulation days for the Dow in the last month (see chart), while we've had no significant distribution days. One of them occurred right as the DJIA chart was reaching its recent peak at 11,000, but the most recent one occurred while this index was in the middle of a sideways mode. Two high volume days don't make for a bull trend, but it's a decent start. We'd hesitate to call it institutional accumulation just yet - we'd need to see it a few more times. However, the volume (and direction of volume) here is at least as important to us right now as the price action is. We'll keep an eye on that and let you know of any major developments.
Dow Jones Industrials Chart - Daily

Price Headley is the founder and chief analyst of BigTrends.com.