One of the toughest parts about becoming a great trader is mastering the trading nuances that are difficult to define. It's a pretty straight-forward task to define goals, develop a written trading plan, create a trading system (that works), or apply good money management. All of those things are mechanical ideas that any trader can apply - even a new trader that may not have much experience. But eventually, to go from good to great, a trader has to develop an understanding of the things that are not quite so mechanical.....maybe even things that are obscure. Today, we'll look at one of those things that's tough to conceptualize, but worth the effort.
Let's start with our key point first.........not all buy signals are the same. I wanted to start out with that notion, because it will be important to know where this is going as you continue reading.
To illustrate the idea, I'm going to make an important assumption - that you have some sort of methodology for selecting trades. This is an idea we've looked at in great detail with recent TrendWatches. We almost exclusively use technical analysis to find trades. For instance, TradeStation allows us to have real-time 'scanning' of pre-defined trade parameters. Once a stock or an index meets that criteria, a trade is triggered. In other words, a 'buy' or 'sell' signal is sent to us. As an example, a very basic trading system might just be to go long (buy) a stock whenever the 20 day moving average crosses over the 50 day line. With only a couple of mouse-clicks, we can find all the stocks that are making that particular crossover on any particular day. It's an easy an efficient way to find a pool of trading ideas.
This particular software package is great for technical analysis, but that doesn't have to be your method. Maybe you're a value player, or maybe you trade commodities, or maybe you practice astrology to pick stocks - it doesn't matter. As long as your method helps you buy low and sell high, it's a good system.
The question is, is your system good enough?
Although we freely acknowledge that we use crossover signals quite a bit, we also recognize that there's an important trading aspect missing from that kind of system......acceleration, and momentum. In other words, just because we're getting a moving average crossover (a trade signal), it doesn't mean that the trade is a great trade - or even a good enough trade. If it took 300 days for the stock to finally pull the 20 day line above the 50 day average, do you think the stock is really moving fast enough to be worth trading? Probably not, yet most folks would still think about buying that stock. If you'd be better off just buying an index instead of an individual stock, why bother with a stock at all? If you're going to take the risk of owning a stock, you have to make sure you'll get enough gains in a short period of time to make it worth it. If you have a lazy chart, we recommend you keep looking for a stock that is accelerating enough to at least outpace the market.
Will you always be right? No - the success rate of fast movers won't really be any better than your success rate with slow movers. However, your bottom line should improve greatly, because the winning trades you do have should be much bigger than the losers.....because they moved by a great degree in a short amount of time (shorter holding periods will also let you squeeze more good trades into a trading year).
OK, so by now you should understand why you need acceleration, but maybe you're asking how you can sort and scan for those stocks. This is where it gets trickier. While many websites offer free (or at least low-cost) "crossover" signals, there aren't many sources that distinguish or rank stocks based on acceleration or momentum. Similarly, even the software packages that allow you to custom-build trading systems have a tough time with ranking stocks based on momentum. That is, crossover signal systems are easy to build, but when you ask the software to 'think', the system-building gets a lot more difficult.
I encourage you to think about the good acceleration/momentum tools you might already have at your disposal. These are Bollinger bands, moving average envelopes, or our proprietary Acceleration bands. Each of these can indicate whether or not a stock is moving or not, but they can also indicate how much acceleration or momentum a stock trend has - something a simple moving average crossover system can't do. Let's look at an example.
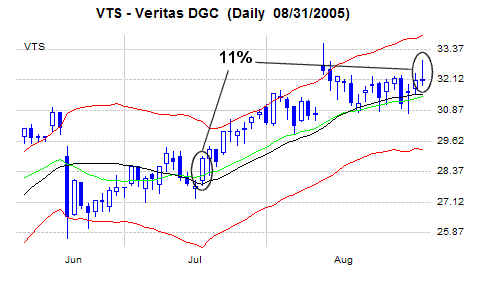
Let's compare the results we would have gotten by taking an Acceleration band signal versus a moving average crossover signal. This set of signals occurred on July 19. We've plotted a 20 day moving average as well as 20 day Acceleration bands on both charts, so we can compare the two types of indicators. The moving average crossover signal presented Veritas DGC (VTS) as a buy candidate. Between then and now, the stock has gained a respectable 11 percent.
Veritas DGC (VTS)
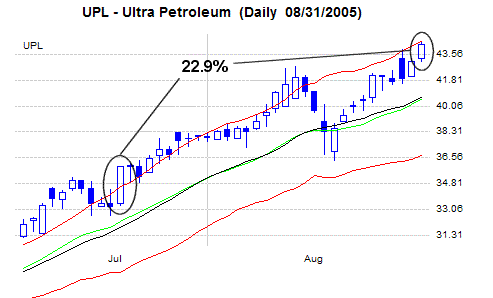
Our best Acceleration band signal found Ultra Petroleum (UPL) on the same day. During the same period, this stock is up 22.9 percent.
Ultra Petroleum (UPL)
So what was the difference? Acceleration. Momentum. Call it whatever you want, but the concept is still the same - you need to find the trades that are best poised for a bigger, faster move. Will doing this always yield the same results you see above? Not at all. But given enough time, finding the slightly better trades will really beef up your bottom line.
Price Headley is the founder and chief analyst of BigTrends.com.