Which moving average is more useful: the exponential or the simple? I think they are both meaningful, especially when viewed together on the same chart.
I often receive the question whether I prefer the Simple Moving Average (SMA) or the Exponential Moving Average (EMA). A simple 10-day moving average takes the average of the last 10 trading days' closes. An exponential 10-day average uses a weighted approach that places more emphasis on the more recent closes compared to the previous closes. As a result the EMA tends to adjust faster to market moves. This is a good thing in trending markets, while it can create more whipsaws or fakeout moves in choppy markets. I tend to prefer EMA's when looking at the moving averages alone as an indicator, but on my indicators that use bands, like my Acceleration Bands, I tend to like using the SMA's as the reference point for the bands. This creates smoother upper and lower bands in my experience.
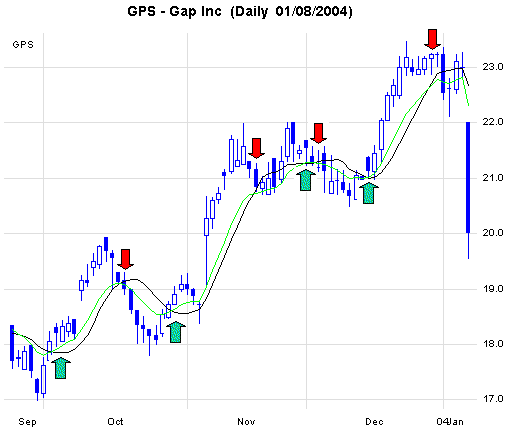
But here's a new idea we have not discussed here before. What would happen if we combined the use of both the simple and exponential 20-day moving averages on the chart at the same time? Since the exponential is faster to react that the simple to new trends, then the exponential should turn up above the simple in new uptrends, while turning below the simple in new downtrends. That's the theory. Let's see how it works. I was curious about how retailer Gap Inc. (GPS) looks, since the stock was down 3 points at the most recent day on the chart despite a strong market. And sure enough, the EMA (in green) actually had broken below the SMA back on December 31, right as the stock peaked. Note that if you were following a trading moving average system, you would have re-entered the bull side when the stock closed above both the EMA and the SMA the prior two days. In contrast, the EMA crossed under the SMA and refused to reverse back over the SMA. In this way this indicator smoothes out the day-to-day market noise.
I've noted the bullish crossovers with up arrows (in green) and the bearish crossovers with down arrows (in red). Note the general accuracy in which the change in trend is marked by the early warning sign of the EMA crossing the SMA. The whipsaws that occur in mid to late November are typical of a non-trending period. But the point here is that this indicator not only catches the big trends, but it also warns when the end of a trend is here, in advance of major reversals in many cases.
Gap Inc. (GPS) with 20-Day Simple Moving Average (in Black)
and 20-Day Exponential Moving Average (in Green)

Price Headley is the founder and chief analyst of BigTrends.com.