NASDAQ Commentary
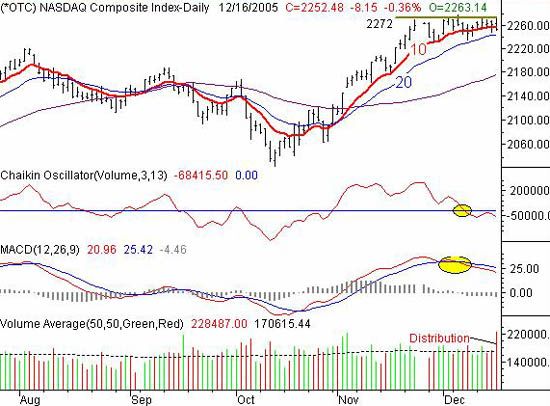
The NASDAQ Composite continued to move sideways last week, slipping just 4.25 points (-0.2%) to end the week at 2252.48. Although that dip is negligible, the bulls should be concerned again. In our MidWeek Update from Wednesday, we admitted that the charts were hinting at an upside move, following a three week period of virtually no movement. But after we saw a close under the 10 day average for the week, we're much less convinced of that bullish notion. In fact, the volume tide tipped back in favor of the bulls. This essentially left the composite still stuck in a rut. Fortunately, we still can define what will signal a breakout from that range......now we just need to see it happen.
The real story here is the continuing resistance at 2272. We had previously spotted that line at 2270, but the NASDAQ has inched just above the 2270 level several times in the last few weeks, leading us to that slight adjustment. In fact, that 2272 barrier became even more clear this past week, after the composite topped out there on Tuesday as well as Friday.
But a lack of upward movement here isn't the only concern for the bulls. The fact of the matter is that the technical indicators are still bearish (or just turned that way). That close under the 10 day average is at least the first half of an important sell signal. The second half will be complete when and if we close under the 20 day line. The thing is, the 20 day average (blue, currently at 2243) has been verified as support already for other indices; we think it will be for the NASDAQ too, when the time comes.
On the other hand, we're now several days into two key complete sell signals. One of them is the bearish MACD crossunder, and the other is the Chaikin line cross under zero. We have to call things as we see them, and as we see them right now, the bears have a little more control. And after we saw a high volume selloff on Friday, we have to wonder if Christmas won't be all that merry this year. However, until the NASDAQ can actually work its way out of this tight support/resistance zone, we're still on hold for the most part.
NASDAQ Chart - Daily

S&P 500 Commentary
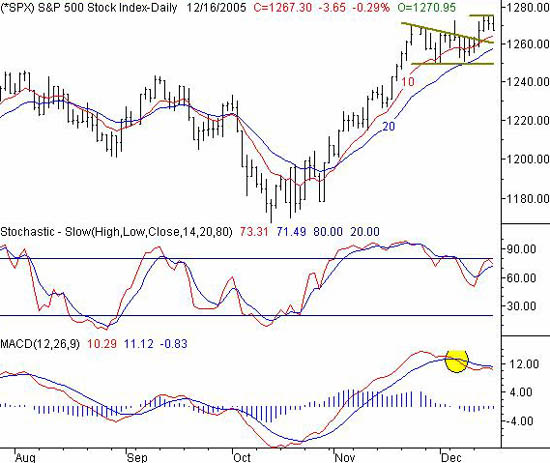
The S&P 500 was the only index to hit new 52-week highs again, when it reached to 1275.80 on Wednesday. However, it was unable to hold onto this gain, as it fell back to 1267.30 by the end of Friday's trading session. Still, the SPX's 7.95 point gain (+0.63%) was the best showing for all the major indices last week. That, however, may not be enough to satisfy and encourage more buying just yet.
As is stands right now, the deck seems to be stacked against the S&P 500. After hitting a new high in the middle of the week, the index fell the rest of the week. That turned both of the stochastic lines lower again, and rekindled the bearish divergence in the MACD chart. On the other hand, both MACD and stochastics were bearish at the end of last week too, yet the index overcame both to put up some decent numbers.
And in terms of momentum, the scenario is actually bullish. Even with the bearish tone at the end of the positive week, the fact of the matter is that the SPX is well above all the key moving averages. Plus, that resistance line that had kept the S&P contained for most of December was finally breached on Tuesday. So, perspective is really needed here to make sense of the chart. From a very short-term view, the current direction (and coming out of an overbought situation) looks bearish. But from a bigger picture perspective, the trend is still bullish. Six of the last eight weeks have been winners, including the most recent one. Plus, those moving averages line we're above right now have also been support lines on more than one occasion. So, until the S&P 500 closes a couple of times under the 20 day average, we really can't think about being bearish here.
S&P 500 Chart - Daily

Dow Jones Industrial Average Commentary
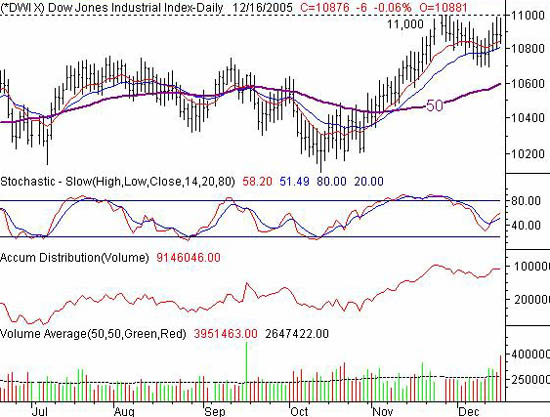
The Dow managed to pull itself up by the bootstraps last week, moving higher by 97 point (+0.90%) to actually - and stunningly - lead the charge. However, a familiar resistance line once again came into play, sending the blue-chip index lower again shortly after the mid-week rally began. Like the other indexes, the Dow is trapped in a rather tight range, and poised for a break soon.
The same mixed messages that we discussed above also apply for this chart - this index is trapped under some major resistance at 11,000, yet has managed to find support at the 10 and/or 20 day averages for most of the last several weeks. But for the Dow specifically, we see a slightly bullish quality. Namely, volume has remained mostly positive. Although Friday was a major distribution day (a high volume selloff), it was also an option expiration day, which may have skewed total trading. Prior to that, though, the buyers were growing in number. Even during the lull over the last three weeks, the volume never turned bearish - just stagnant. And with the exception of Friday, the volume looked like it was turning bullish again. That's easily see in the rising accumulation-distribution line, which is why we're now turning mildly positive on these large-cap stocks.
But, there's another dynamic coming to light here...
It's interesting to see the Dow gain while the NASDAQ loses, like it did this week. We have to bring up the possibility that the market is shifting gears here, getting rid of the riskier, aggressive names traded on the NASDAQ, and seeking out the stable names in the Dow. That mentality is a sign of only modest bullishness, versus the 'hog-wild' variety of bullishness that we saw for most of November. That's neither good nor bad, but it can make a difference in where the pockets of strength are. For the time being, there's not enough data to say that's exactly what's happening. But, we'll keep an eye on the inter-play between the NASDAQ and other indices and let you know of any major shifts in market tone.
Dow Jones Industrial Average Chart - Daily

Price Headley is the founder and chief analyst of BigTrends.com.