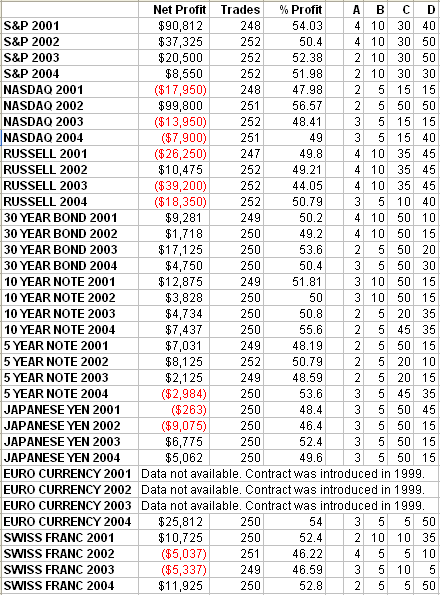
As I mentioned, I had a bad (and very costly) experience optimizing markets individually. I don't know how I could have been so dumb as to use a 26-day closing average in yen, 14-day in Swiss Franc and 31-day in bonds just because those were the best numbers turning up. Did I really believe there was something magical about those particular arbitrary figures? I guess I just felt that I would be placing myself somewhere within the fat part of the bell curve of results. Whatever, it didn't work.
That's why I find my latest studies a little perplexing, albeit interesting. I am able to generate significant one-year virgin profits by optimizing the three parameters of the original combo system (click here to view in a new browser window) in the preceding five years of data. I'm encouraged by this for a number of reasons. For one thing, the components of the idea are apparently more robust than what I had been trying to use before. You can settle on second, third, fourth best ‚Ä" even something near the bottom of the results and still generate positive numbers. For another, it suggests even better things upon further refinement. Keep in mind we found more than just the original three indicators.
Every one of the results was simulated ‚Äúreal-time‚ÄĚ data generated from preceding years. You're in effect looking at one year snapshots of trading into the future. (1996-2000 produced the 2001 results. 1997-2001 produced the 2002 results, etc).
By the way, the optimization was done for the best percentage of profitable trades. If you're looking for a bias to persist, obviously there's validity in knowing how often something played out according to expectations.

Four columns follow the percent profitability. Columns A and B are the optimized averages of the original 2-day/5-day moving average system (view here). If the first average produces a lower close than the second, that's bullish. The third column refers to the simple average close compared to yesterday's close. (If the close is greater than the average, it's bullish). The last column is the number of days you look at when determining whether an extreme closing low occurred before the highest (bullish) or after it (bearish).
P.S. I'd love to receive feedback from you. Please leave a comment or discuss the article by clicking on "Make a comment on this article" below.
Art Collins is the author of Market Beaters, a collection of interviews with renowned mechanical traders. He is currently working on a second volume. E-mail Art at artcollins@ameritech.net.