| The Wagner Daily ETF Report For April 3 |
| By Deron Wagner |
Published
04/3/2012
|
Stocks
|
Unrated
|
|
|
|
The Wagner Daily ETF Report For April 3
Stocks edged higher on Monday amidst light trade. All five major indices closed higher on the session, as the small-cap Russell 2000 led the advance by posting a 1.2% gain. Led by a strong showing from AAPL, the Nasdaq advanced 0.9%. The S&P 500, S&P MidCap 400 and Dow Jones Industrial Average closed up by 0.7%, 0.5% and 0.4% respectively. The precious metals, insurance and computer hardware sectors outperformed the market on Monday, while homebuilders showed the most relative weakness.
Market internals ended the session mixed. Volume fell on the Nasdaq by 1.1% and on the NYSE by 7.8% compared to Friday's numbers. Advancing volume did however hold the upper hand for the entire session. By the closing bell the spread ratio closed at a plus 3.8 to 1 on the NYSE and a plus 2.2 to 1 on the Nasdaq. Although the market closed higher yesterday, the light volume suggests that institutions were not participating heavily in the day's action.
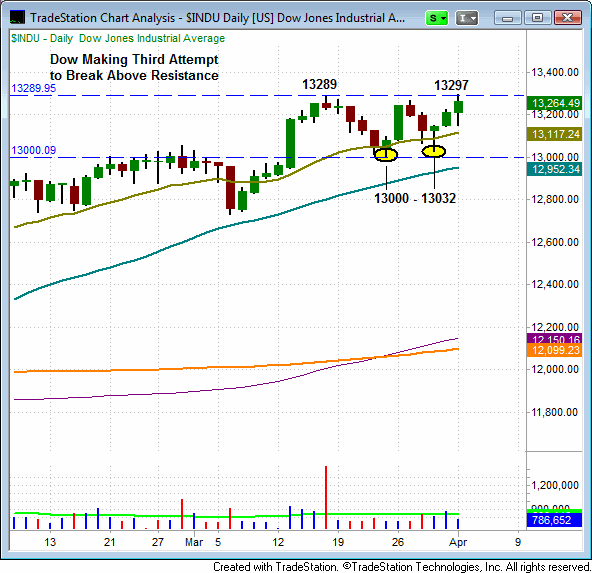
Listed below are the key support and resistance levels in the broad market averages (daily and weekly charts of the DJIA, Nasdaq and S&P 500). Yesterday, the Dow Jones Industrial Average set a new 52-week intraday and closing high. However, the DJIA was unable to break out of its three week trading range and the move occurred on light volume. We wouldn't be surprised to see a failed breakout at the 13,300 mark if the Dow is to move to significantly higher ground. If the Dow can take out the 13,300 mark, the next big resistance is near 13,800 (see weekly chart). Support levels on the DJIA include the 20-day EMA (13,120), the 50-day MA (12,950) and the swing lows at 13,030 and 13,000.

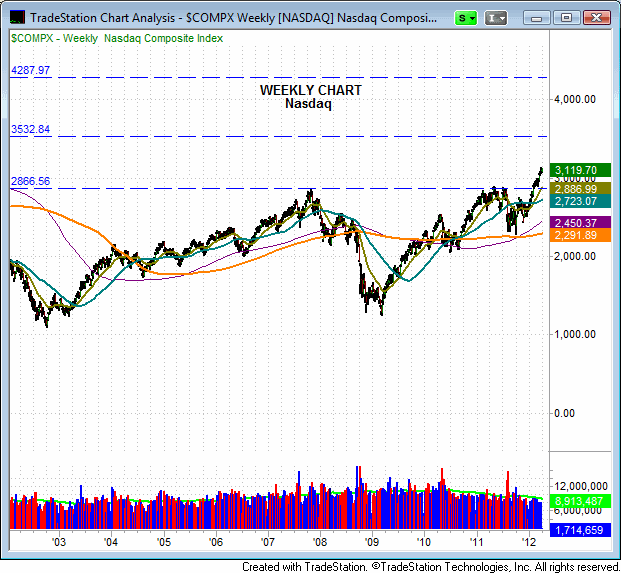
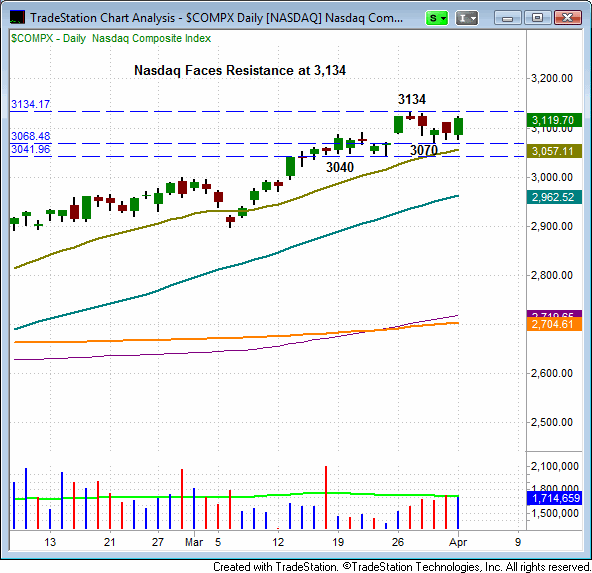
The Nasdaq has led this current leg of the rally higher. However, unlike the DJIA and the S&P 500, the Nasdaq failed to establish a new 52-week high yesterday. This price action may suggest that the Nasdaq needs to consolidate and "take a rest" prior to a potential move higher. The Nasdaq faces short term resistance at 3,134 and has support near 3,070 and 3,040. On the weekly chart you will notice that the Nasdaq is the only index that has cleared its 2007 high. Further, the Nasdaq is currently at an 11-year high. The next major resistance level on the Nasdaq is near 3,530 (see weekly chart).
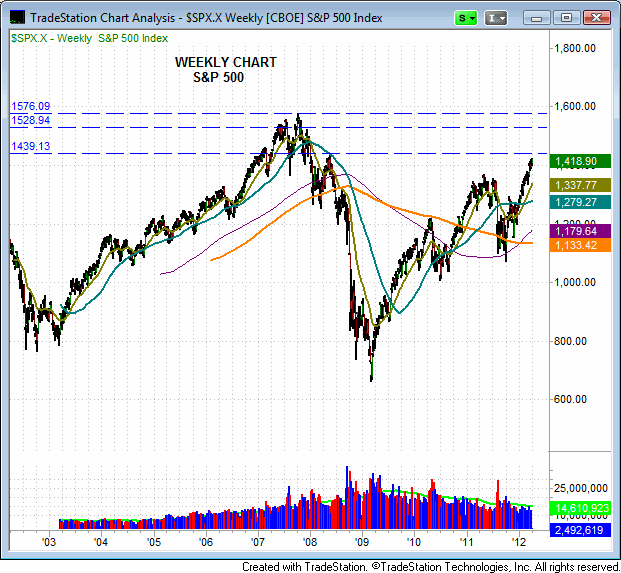
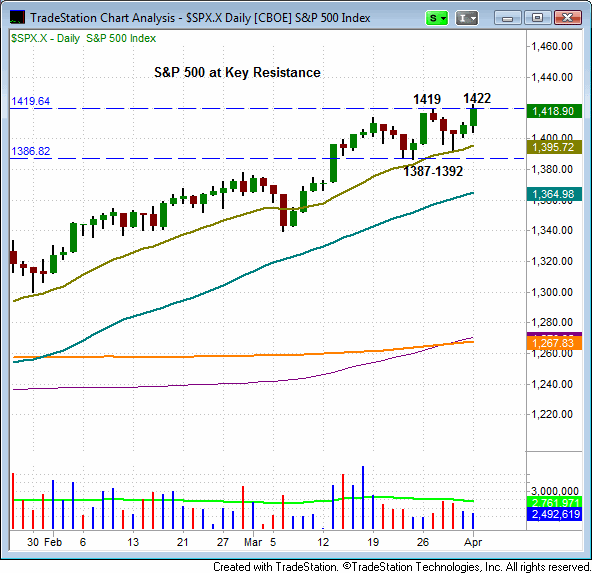
The S&P 500 attempted to break through resistance at 1,420 yesterday, but it fell just short as it closed just below this key mark. Short-term support levels on the S&P 500 include 1,392 and 1,387. If the S&P manages to clear the 1,420 level, its next key resistance is near 1,440 (see weekly chart).
Deron Wagner is the Founder and Head Trader of both Morpheus Capital LP, a U.S. hedge fund, and MorpheusTrading.com, a trader education firm.
|