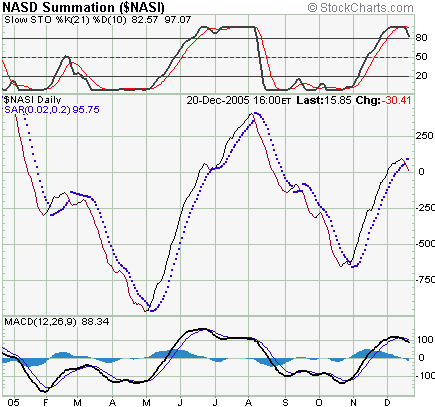
The Nasdaq Summation Index basically measures the gap between advancers and decliners in the Nasdaq. As advancers outnumber decliners, these positive numbers are summed to create a rising Summation line, while when decliners start to win out, that negative weight will subtract from the Summation and eventually lead to a declining line.
Currently from the chart below, you can see that the Nasdaq Summation line has just broken below the uptrend that started in early November, as defined by the line breaking below its 20-day Parabolic Stop and Reverse (SAR) line (with a .02 acceleration factor). One concern is that the recent new high in the SAR is not being supported by the MACD line, which is currently making a lower high. That bearish divergence will help the bear case once the SAR line breaks down, but we are not there yet.
Nasdaq Summation Index ($NASI)

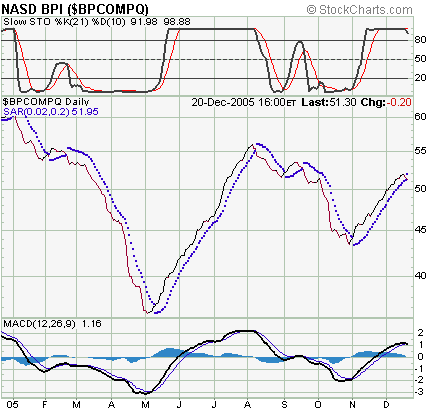
The Bullish Percent on the Nasdaq Composite ($BPCOMPQ) is even more convincing as a trend indicator. The Bullish Percent indicator is derived by taking the percentage of the stocks within the index that are on buy signals according to the Point & Figure methodology. Looking at the chart link below, this indicator has more clearly trending especially during up moves. But here too, like the $NASI, the Parabolic Stop has just been tagged and momentum indicators are turning over to the downside.
Bullish Percent on the Nasdaq Composite ($BPCOMPQ)

So the bottom line from the trend indicators on the Nasdaq is for a bumpy road ahead in the next month or so. You can look at the Dow and S&P 500 too, but I find the Nasdaq tends to lead the train.
Price Headley is the founder and chief analyst of BigTrends.com.