NASDAQ Commentary
A whole lot has changed since this time last week. In fact, you could say that everything has changed. A week ago, the NASDAQ was still euphoric over hitting a new 52-week high of 2278.16, and was pressing to go higher. Over the previous two days though, not only has the composite not gone higher, we've actually seen a major breakdown. That reversal looks like it's the real deal too, and not just a little volatility. On the other hand, the bulls are making a respectable showing today.
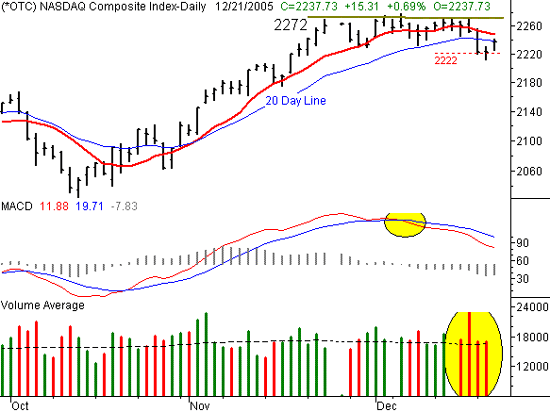
Today's NASDAQ chart is actually pretty simple. We saw two consecutive closes under the 20 day average, which is a complete short-term sell signal. Of course, the index is rallying right now, hovering right at the 20 day line parked at 2239. That makes today a pivotal day, but we really won't know on which side of that pivot we'll end on until 4 PM EST....when the market closes. But even then, the slant is still a bearish one. A close above the 20 day line will only mean that the chart has stopped the fall, which may only be a temporary plug. It won't be bullish again until we see a close above the 10 day average, which is at 2249. And really, we'd be suspicious of any move higher until we got a close above 2272, where we topped out three times last week.
On the other hand, a close under the 20 day average would be considerably more bearish, now that we've already got some bearish momentum behind us. That means we could still close higher today, yet remain bearish. That said, for the strict disciplinarians, we want to see another LOWER close under the 20 day average to get officially bearish. That just means when and if we get a close under 2222, then we'll be 100% bearish. After all, we already have a bearish MACD cross, and the selling volume certainly hasn't been light.
So, keep an eye on 2239 and 2222 - they're the key signal lines.
NASDAQ Chart - Daily

S&P 500 Commentary
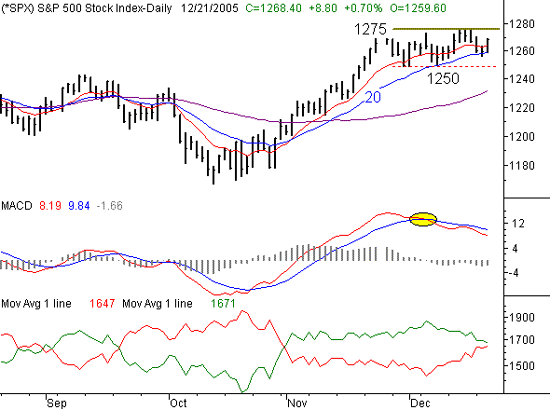
The S&P 500 is the wrench in the works. It actually found support at its 20 day average, and has since crossed back above its 10 day line. From a technical perspective, that's bullish.....and clearly at odds with our NASDAQ thoughts.
The only reconciliation we can offer is to note that the SPX is still stuck in the same range it's been stuck in for a few weeks, which can also be said for the NASDAQ chart. The upper edge of this range is 1275, where the index topped out the last three days of last week after hitting a new 52-week high there. So despite the support at the short-term averages, we're not buying into this bullishness until we see trades at 1276 or higher. Likewise, we're not going to turn bearish here until we see a move under 1250. Note that the 20 day line is at 1259, which means even if we cross under the 20 day average, we still won't be completely convinced. But.......
While the S&P 500 chart itself may seem a little non-directional, the underlying breadth and depth dynamics have changed quite a bit. On the lower portion of our chart, we've added the moving average lines of the NYSE advancing issues (green) and NYSE declining issues (red).
In short, the 'breadth' of the market is about to turn fully bearish. we don't yet have that crossover signal, but about one more bearish day should do it. As you can see, this is a pretty effective tool. So despite that S&P's resilience, its legs could be kicked out from under it real soon. The 'depth' aspect is in the bullish or bearish volume (not shown), and it too is on the verge of turning bearish.
The point is, between the MACD crossunder and the bearish underpinnings, today's strength is a little bit suspect. We still don't have enough complete signals yet, but we're anticipating a more bearish scenario by the end of the week.
S&P 500 Chart - Daily

Dow Jones Industrials Commentary
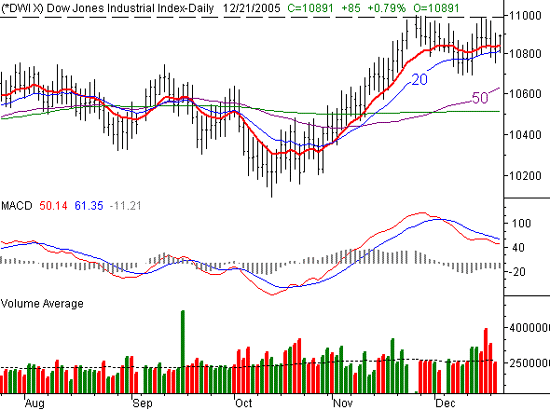
There's not a lot to add here for the Dow, so we won't. The key resistance line is still ultimately at 11,000. So, even though the Dow is also on top of its short-term averages, the overall momentum as well as the general volume has been bearish (despite a couple of accumulation days a few weeks ago). We wouldn't get bullish here until 11,000 is breached. On the other hand, a break under the 20 day average at 10,815 (blue) wouldn't exactly provide a plethora of bearish trading opportunities. The 50 day line is likely to be support, currently at 10,620 (purple). Plus, the Dow has actually been the better performing index of late. We still think that's largely a symptom of investors getting out of speculative names and into these safer ones. However, don't assume that this means the Dow will rise as the NASDAQ falls.....it just means that it won't fall as much as the NASDAQ when and if this downturn finally takes shape.
Dow Jones Industrials Chart - Daily

Price Headley is the founder and chief analyst of BigTrends.com.