| The Wagner Daily ETF Report For June 11 |
| By Deron Wagner |
Published
06/11/2012
|
Stocks
|
Unrated
|
|
|
|
The Wagner Daily ETF Report For June 11
Stocks posted solid gains on Friday but trade was light. All of the major indices closed in the black. The small-cap Russell 2000 demonstrated the most strength as it climbed 1.2% on the day. The Nasdaq posted a 1.0% gain, while the S&P MidCap 400 tacked on 0.9%. Both the S&P 500 and the Dow Jones Industrial Average finished 0.8% higher.
Market internals ended the session mixed. Volume was light on both exchanges. On the Nasdaq, turnover slid by 15.3% and on the NYSE by 15.0%. However, advancing volume outpaced declining volume across the board. By the closing bell, the spread ratio stood at a plus 3.9 to 1 on the Nasdaq and a plus 2.5 to 1 on the NYSE. Although Friday's price action was bullish, volume was weak, thus eliminating any possibility of an "accumulation day" (higher volume gains in the broad market).
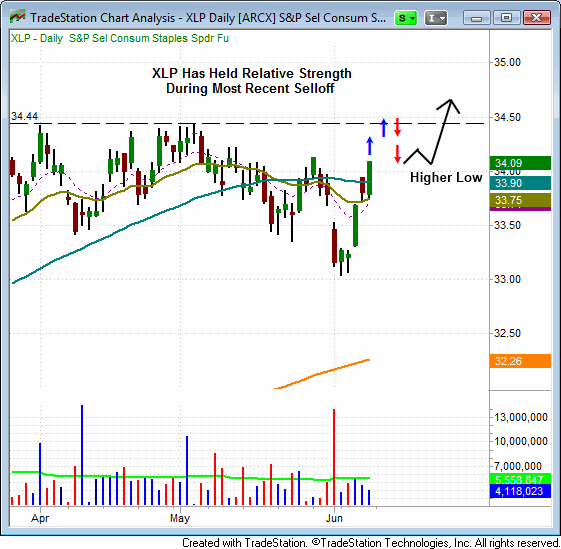
During the recent market correction, S&P Consumer Staples SPDR ($XLP) has shown relative strength to the broad market. Unlike most ETFs, XLP never came close to testing support of its 200-day moving average. Further, as of last Friday, XLP reclaimed shorter-term support of both its 20-day and 50-day moving averages. Now, XLP could present a swing trading buying opportunity on a test of, and pullback from, resistance near its most recent swing high of $34.50. Following a pullback from this level, we would look for XLP to ideally form a "lower high" and a "higher low." The lower high could potentially serve as a buy entry trigger, and the higher low could serve as a protective stop for this technical trade setup. It is too early to consider XLP as an official setup, so it is not yet on today's "watchlist" segment of The Wagner Daily, our swing trading newsletter. However, since our market timing model could soon provide a buy signal, we must be prepared to seize new opportunities on the long side of the market. The daily chart below illustrates this trade setup:

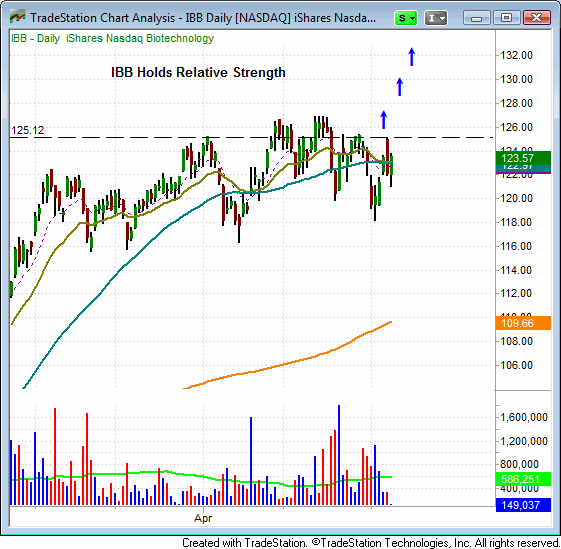
Another ETF that has held relative strength is the iShares Nasdaq Biotechnology ETF (IBB). Since the beginning of 2012, IBB has been consolidating in a range between $116.00 and $127.00. If the market firms up, IBB's next test of the $127.00 resistance mark could result in a sharp move higher. See the annotations on the following daily chart:

As of this writing (late Sunday night), both the Nasdaq and S&P 500 futures are sharply higher. If this price action holds throughout Monday's regular stock trading session, the broad market is likely to put in an accumulation day and may also provide our buy signal. However, if we remain in a bearish market, false buy signals often occur, and the market can reverse again quickly. In bearish environments, it is not unusual to see a buy signal nullified within two or three days of triggering. Still, if we do get a buy signal, leading stocks and ETFs could easily break out quickly. In the current state of affairs in the stock market, caution is warranted.
Deron Wagner is the Founder and Head Trader of both Morpheus Capital LP, a U.S. hedge fund, and MorpheusTrading.com, a trader education firm.
|