| The Wagner Daily ETF Report For June 20 |
| By Deron Wagner |
Published
06/20/2012
|
Stocks
|
Unrated
|
|
|
|
The Wagner Daily ETF Report For June 20
Stocks closed higher on Tuesday as trade improved. All five major indices closed well in positive territory. The small-cap Russell 2000 put in the most impressive showing, as it tacked on 1.8%. The Nasdaq added 1.2%, while the S&P MidCap 400, S&P 500 and Dow Jones Industrial Average advanced 1.1%, 1.0% and 0.7% respectively.
Although we have a buy signal in place, we are now at resistance of the 50-day MA on all of the major indices. This would suggest that we may see either a pullback from or consolidation at the current levels over the next several sessions. Now that we are at a key resistance level in the broad market, a brief review of the Nasdaq and the S&P 500 are in order
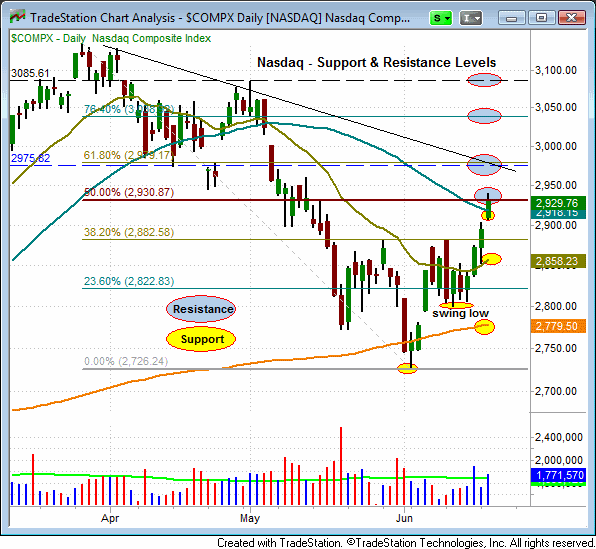
Nasdaq Composite: Key Support & Resistance Levels
On a burst of volume, the Nasdaq closed above its 50-day MA yesterday and this level should now offer some support. However, it is not unusual for a stock, index or ETF to pull back from its first attempt to crack through a major moving average, following a significant move lower. If the Nasdaq should hold the 50-day MA, its next significant resistance level is near 2980. If $COMPX eventually pulls back from its current level, it will probably retest and find resistance at yesterday's high before moving lower. Above this mark, $COMPX has significant overhead near 2980 and 3085. Yesterday's low, the 20-day EMA and the 200-day MA should act as important support levels for the Nasdaq.

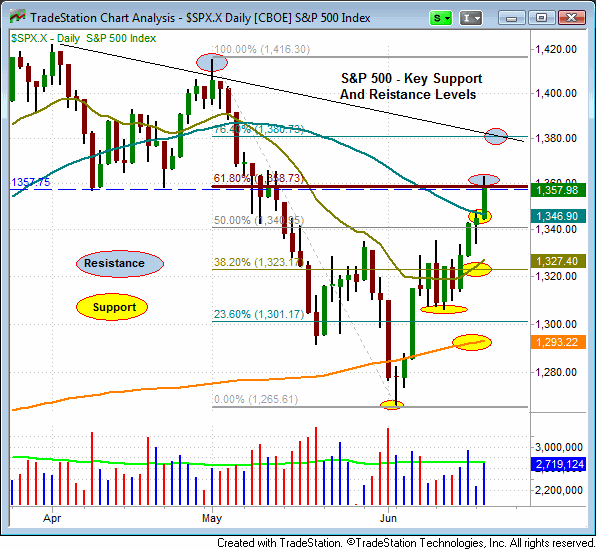
S&P 500: Important Support & Resistance Levels
The S&P 500 also surged above its 50-day MA yesterday on higher volume. Yesterday's high (1363), 1380 and 1420 should all present resistance for the S&P. As with the Nasdaq, the 50-day, 20-day and 200-day moving averages are significant support levels on the $SPX.X.

With the market in buy mode we will focus most of our attention on identifying long setups during market pull backs. It would take several significant distribution days to nullify the recent price action on the long side of the market. Keep in mind that the first move higher following a market correction does not generally yield stellar results. The important thing is that we continue to see institutional accumulation during pullbacks and as the market works its way higher.
Deron Wagner is the Founder and Head Trader of both Morpheus Capital LP, a U.S. hedge fund, and MorpheusTrading.com, a trader education firm.
|