| The Wagner Daily ETF Report For July 10 |
| By Deron Wagner |
Published
07/10/2012
|
Stocks
|
Unrated
|
|
|
|
The Wagner Daily ETF Report For July 10
In an uneventful session, stocks moved modestly lower on Monday, on slightly higher trade. The Dow Jones Industrial Average, S&P MidCap 400 and the small-cap Russell 2000 all closed down 0.3%. The Nasdaq and the S&P 500 both shed 0.2%. Stocks did however, close well off session lows.
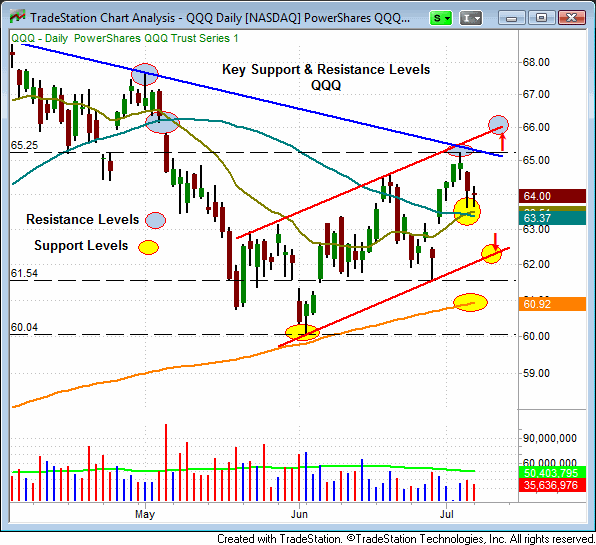
Since the market appears to be in consolidation mode, it's probably a good time to do a review support and resistance levels in the broad market. The following chart of the Powershares Nasdaq Trust (QQQ) shows that the price action in this ETF has been contained by a tight trend channel (Red lines) since the June 4th swing low. Trend channels provide an excellent gauge for determining support and resistance levels. The trend channel suggests that QQQ should find support near $62.40 and resistance near $66.00. Other key support levels include the convergence of the 20-day and 50-day moving averages ($63.30 - $63.50), the 200-day moving average ($60.92), the June 28th swing low ($61.54) and the June 4th swing low ($60.04).

The SPDR S&P 500 (SPY) has also formed a trend channel similar to the QQQ. The next important resistance levels on the SPY are the July 3rd swing high ($37.51) and the upper trend line of the trend channel (Red up arrow near $139.00). Key support levels for the SPY include the convergence of the 20 and 50 day moving averages ($134.00 to $134.40), the lower trend channel line near $133.20, the June 25th swing low ($130.85), the 200-day MA ($130.52) and the June 4th swing low of $127.14.

As is evidenced by the charts of the QQQ and the SPY, both of these ETFs, and by extension the broad market, have a considerable number of both support and resistance levels. This suggests that we could remain in a trading range throughout the summer. In the absence of big volume, it is generally difficult for the market to make a significant move out of a range. Consequently, we wouldn't be surprised to see a lack of significant movement in the broad market, during the low volume summer doldrums.
Deron Wagner is the Founder and Head Trader of both Morpheus Capital LP, a U.S. hedge fund, and MorpheusTrading.com, a trader education firm.
|