NASDAQ Commentary
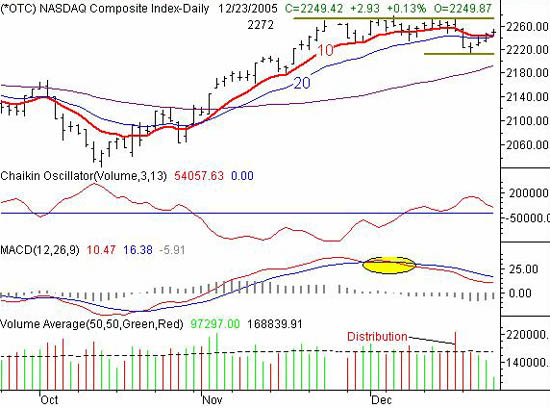
Last week, the NASDAQ fell back by 3.06 points to close at 2249.42. That 0.14% loss, though, would have been a gain had it not been for Monday's major selloff. In fact, despite Monday, the NASDAQ rebounded nicely over the last four days of the week, bringing it back above all the key short-term moving averages. So as before, we're getting mixed messages.
What's bullish?
Not only did the composite cross above the 10 and 20 day lines on Thursday, it stayed above them on Friday, as it made an even higher close. That's a complete 'buy' signal (one of many we have though). More than that, it appears as if the 10 day average (red) actually acted as support, sending the NASDAQ back to 2249.42 when the 10 day average was touched with the low of 2245.58.
What's bearish?
Although the NASDAQ gained, this rally had nowhere near enough participation to reflect the majority opinion. In other words, the rise in the latter part of last week wasn't a case of having more buyers than sellers. It was a case of having virtually no sellers to get in the way of a very limited number of buyers. Look at the volume bars at the bottom of the chart. Despite the gains between Wednesday and Friday, each of them came on successively lower volume. Plus, none of those days even came close to rivaling the volume behind the selloff just a few days before that (the 'distribution' bar, and the ones around it).
To be objective about the volume trend, we've plotted a Chaikin line in the middle of our chart. It tells the same story - despite the gains last week, the volume trend is still mostly bearish - it's been falling even while the market has been rising. The technical signal here is a cross under the zero line, which at this rate could be very soon....all it would take is a couple of moderate losses on moderate volume.
So, as we did last week, we still see an index that's trapped in a tight range. And, we'd be hesitant to do much of anything until that range is broken. The upper boundary is still at 2272, while the lower edge is now at 2213, where the NASDAQ bottomed last week (note that 2213 is under the 20 day average, which we had previously marked as support).
Be sure to read our 'Bottom Line' at the bottom of this report.
NASDAQ Chart - Daily

S&P 500 Commentary
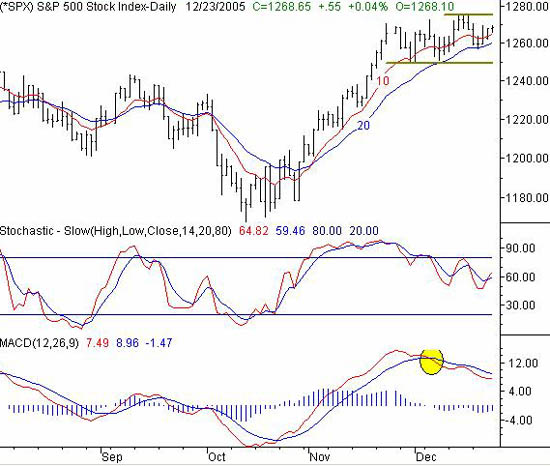
The S&P 500 once again managed to make gains at the expense of the NASDAQ. The large-cap index gained 0.11% last week to close at 1268.65. That 1.35 point gain is minimal, but it at least bought some time for the SPX.
Like the NASDAQ's, the SPX chart crossed above the 10 and 20 day lines on Thursday, and closed just a little higher on Friday. So in that sense, things could be considered bullish (albeit it mildly). But, that doesn't change the fact that the bullish momentum has been fading easily. In fact, the MACD lines still indicate a bearish momentum divergence, as it has since December 7th.
The lines to still watch are 1250 and 1275. That's the zone we've been stuck in for a while - and still are. Until we can break free from that zone, we have doubts that there will be much follow-through in any direction.....we haven't seen any follow-through on anything since mid-November.
S&P 500 Chart - Daily

Dow Jones Industrial Average Commentary
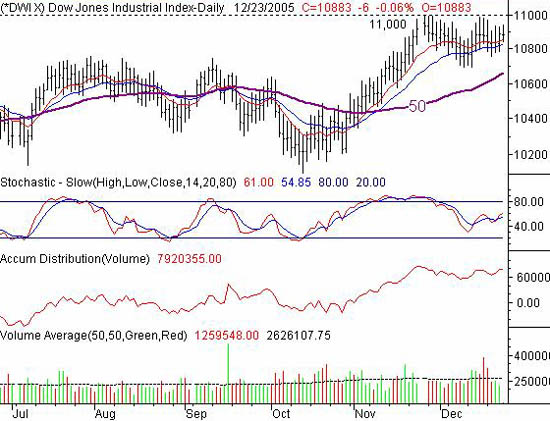
The Dow added seven points last week to close at 10,883, despite Friday's modest loss. It still managed to close above the short-term averages, but that nagging resistance at 11,000 is still a factor. The lack of movement - even on an intra-week basis - leaves very little to talk about. We'll just add that support is still at the 20 day line (10.824) even though the Dow traded under it last week.
Dow Jones Industrial Average Chart - Daily

Bottom Line
Don't read too much into last week's late gains - there was no volume behind them. Additionally, don't read too much into the fact that the NASDAQ is losing while the other two key indices are gaining....that's a rarity. We almost always see the NASDAQ lead the train, so we expect to see the rest of the market follow that lead if the NASDAQ continues to deteriorate.
In the meantime, caution is advised as we make the transition from one calendar year to the next. Don't forget that the market was on fire at the end of last year, only to start a major downturn in the first few trading minutes of this year. A repeat of that is possible, although it may end up being a self-fulfilling prophecy (where traders cause they very thing they fear). On the flipside, if the coming week ends up being bearish, don't necessarily count on that being the case in the following week. A new year is a clean slate, which allows for changes of heart. That's why were being pretty stringent on waiting for a move above resistance lines, or under support lines. We'll look at this bigger-picture idea more in next week's outlook.....the weekend between 2005 and 2006.
Price Headley is the founder and chief analyst of BigTrends.com.