| The Wagner Daily ETF Report For July 25 |
| By Deron Wagner |
Published
07/25/2012
|
Stocks
|
Unrated
|
|
|
|
The Wagner Daily ETF Report For July 25
The benchmark S&P 500 Index closed right at the edge of two key technical support levels yesterday, and a breakdown below that pivotal convergence of support levels in today's session could easily lead to a sharp move lower in the near-term. Given the immediately negative reaction to earnings of Apple ($AAPL), which was trading 6% lower in yesterday's after hours trading, leading stocks, ETFs, and the main stock market indexes could now be on the verge of finally moving out of the choppy, erratic range of the past several weeks, albeit entering into a new intermediate-term downtrend. So, let's take a closer look at the daily chart patterns of the Nasdaq 100 Index ETF ($QQQ) and S&P 500 SPDR ($SPY), two popular ETF proxies for the broad market.
After three consecutive days of selling, several of the broad-based ETFs are now at the lower trend lines of their near-term ascending trend channels we originally discussed in the July 10th issue of The Wagner Daily trading newsletter and in this blog post. On that day, we stated that, "the price action (in both QQQ & SPY) has been contained by a tight trend channel since the June 4th swing lows (see red lines in chart below). We further commented that "trend channels provide an excellent gauge for determining support and resistance levels." Since that time, both QQQ and SPY have continued to find resistance near the upper level resistance of their respective ascending trend channels, and support near the bottom of their trend channel. Below is a review of the two charts we originally posted in that day's (July 10) ETF trading commentary:


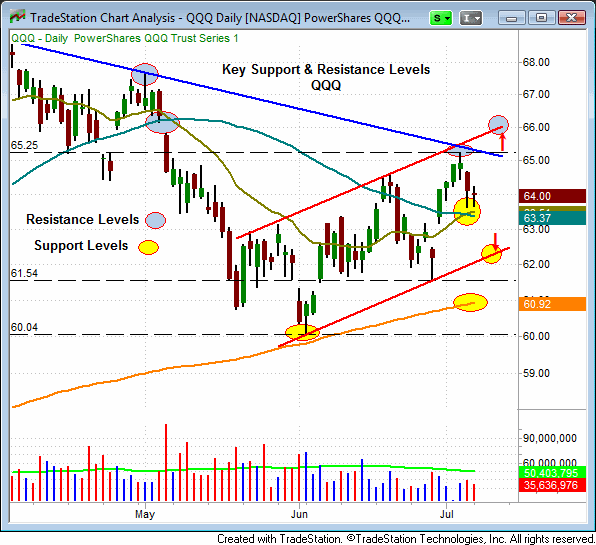
Fast forwarding to the present, check out the current chart of QQQ below:

On the chart above, notice that in yesterday's (July 24) session, QQQ tested and held support of both its 50-day MA (the teal line) and the lower trendline (the ascending red line). The convergence of a key moving average and trend line is typically quite significant support. However, if QQQ now breaks below its low of the past two days, its next significant support levels are the 200-day MA ($61.50 area) and the June 4th swing low (around $60.00). Conversely, even if QQQ happens to bounce today (we must always be prepared for unlikely scenarios), it should find major resistance at its intermediate-term downtrend line (the descending blue line near $64.50), as well as the July 19th high of $65.31.
Although it has been showing slightly more relative strength than QQQ, the main ETF for the S&P 500 Index (SPY) has been exhibiting similar price action to the tech-rich Nasdaq index. In yesterday's session, notice that SPY also "undercut" its 50-day MA, as well as support of its lower trend channel (the ascending red line), before closing to regain support of these key marks. If there is further decline in today's session, SPY has a minor support level at the July 12th swing low of $132.60. Further below, the next major support is between $131.70 and $130.85 (200-day MA and the June 25th swing low). Below these levels, the June 4th low, all the way down at $127.14, is the next critical level of support. All significant resistance levels for SPY are highlighted in light blue. The chart below summarizes these key levels to monitor in the coming days:

Given the after-hours plunge in AAPL, it appears likely that the market will gap down at today's open. If it does, a sudden breakdown below key support levels, such as convergence of the trend channels and 50-day MAs, could lead to a rapid decline in the near-term. Although the broad market still has several key support levels just below (as of yesterday's close), overall technical market conditions continue to erode. If leadership stocks like AAPL continue to take a beating and are unable to quickly recover, the June 4th lows of the main stock market indexes could soon be re-tested. It is also worthy of remembering that markets generally fall much faster than they rise because fear is a stronger emotion than greed.
As planned, we exited our long position in US Natural Gas Fund ($UNG) at yesterday's open, locking in a swing trading gain of over 7.0% in The Wagner Daily swing trader newsletter. In choppy market conditions, one benefit of commodity ETFs such as UNG is their low correlation to the overall direction of the stock market.
Deron Wagner is the Founder and Head Trader of both Morpheus Capital LP, a U.S. hedge fund, and MorpheusTrading.com, a trader education firm.
|