| The Wagner Daily ETF Report For August 17 |
| By Deron Wagner |
Published
08/17/2012
|
Stocks
|
Unrated
|
|
|
|
The Wagner Daily ETF Report For August 17
The broad market averages posted a solid day of gains accross the board on a pick up in volume, closing in the top 20% of the day's range. The small-cap Russell 2000 Index ($RUT) led the way with a 1.1% gain. The Nasdaq Composite Index ($COMPQ) rose a solid 1.0% with the S&P 400 Midcap Index ($MID) just behind at 0.9%. The S&P 500 Index ($SPX) picked up 0.7%, and the Dow Jones Industrial Average ($DJIA) rallied 0.6%. Small cap stocks are finally beginning to wake up which is a good sign for our stock trading sytem, which is focused on small and midcap growth stocks that are trading at/near 52-week highs.
Turnover was higher on both exchanges, registering a bullish accumulation day for both the Nasdaq Composite and the S&P 500. Volume jumped a healthy 27% on the Nasdaq and 17% on the NYSE. Total volume was also well above average on the Nasdaq. The ADV/DEC volume ratio was solid at 3 to 1 on the NYSE but only 2 to 1 on the Nasdaq. Overall it was positive a positive day with strong volume confirming the day's advance.
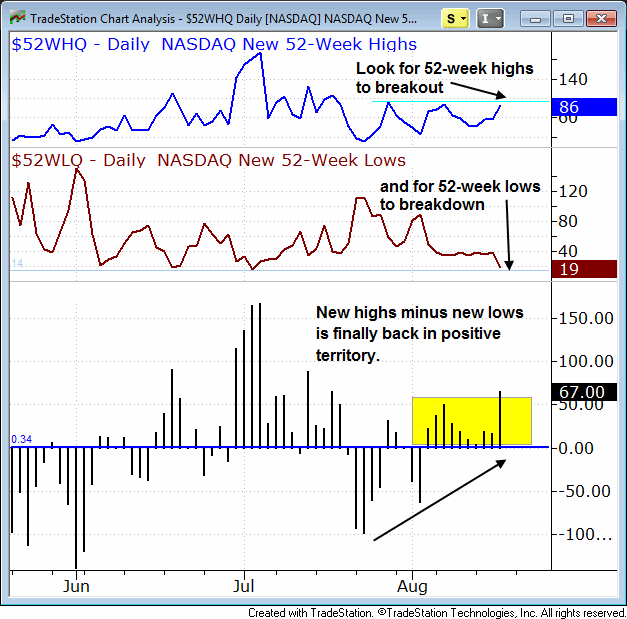
With the market pushing higher we are looking for breadth to expand to confirm the market advance and we are beginning to see that with small cap stocks waking up. Another tool we use to monitor the breadth is a simple chart of stocks making new 52-week highs minus stocks making new 52-week lows. The chart below shows Nasdaq New Highs vs. New Lows. Note that the lines are going in the right direction, with 52-week highs (blue line) putting in higher lows and poised to breakout above the prior swing highs. The 52-week lows line (red line) is setting lower highs and poised to breakdown beneath the summer lows.

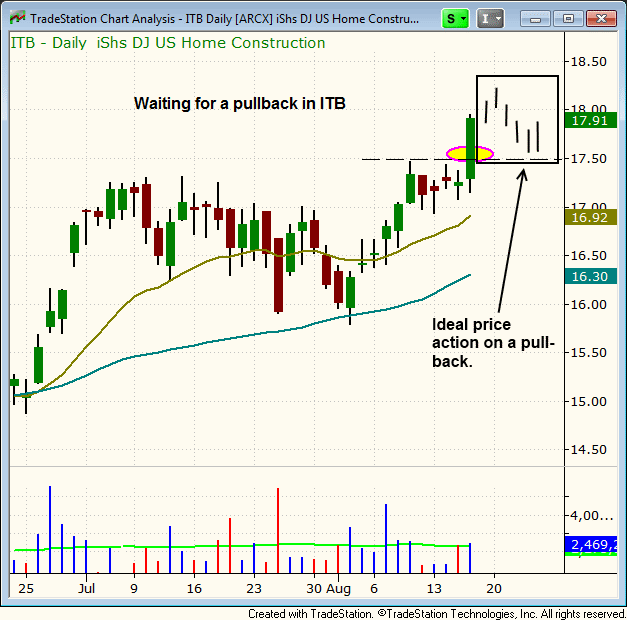
The iShares DJ US Home Contruction (ITB) broke out Thursday on a pick up in volume after a tight ranged consolidation. We are monitoring the action for a potential pullback scenario, where ITB runs up for a few days and then pulls back over three to seven bars. Contrary to what most traders believe, when we buy on a pullback the goal is to not to guess the bottom or buy at the cheapest price. The goal is to buy at the right time by patiently waiting for support to come in and for a low-risk buy point to develop.

Deron Wagner is the Founder and Head Trader of both Morpheus Capital LP, a U.S. hedge fund, and MorpheusTrading.com, a trader education firm.
|