NASDAQ Commentary
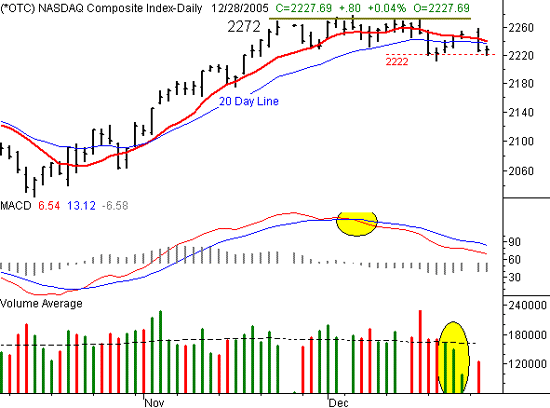
The NASDAQ's big loss yesterday can only muster tepid sympathy today, as the index is holding just a hair above breakeven levels. But even then, we've already made a lower low of 2221.41, and it's doubtful we'll manage to make a higher high (which would be 2259.68). No, the lack of bounceback today tells us the market wasn't kidding around - stocks are a lot less attractive now than they were two months ago.
Granted, we've seen this before......just a few days ago in fact. The composite fell under the 10 and 20 day average, than closed even a little lower the next day before starting a brief rally to push itself just back above the 10 day average. But, that's about as good as it would get. And given that the volume was shrinking the whole time stocks were rising late last week, Monday's big distribution day wasn't a total surprise. The NASDAQ is back under the 10 and 20 day lines for the second time in two weeks, and this time, it looks like it will stay here a while. How's that? The momentum has changed. Last week, the 10 and 20 day moving averages were just flat. This week, they're both pointing lower. In fact, the 10 day line is just about to fall under the 20 day average for the first time in a couple of months. This is, needless to say, bearish.
On the flipside, we marked support at 2222, and so far its held up. We saw a few trades under that mark on Tuesday of last week, but that day was also the beginning of a recovery move. And today's low basically matches that support. So, we're definitely going to keep an eye on the 2222 level. A close under that line will clinch our bearish posture here.
NASDAQ Chart - Daily

S&P 500 Commentary
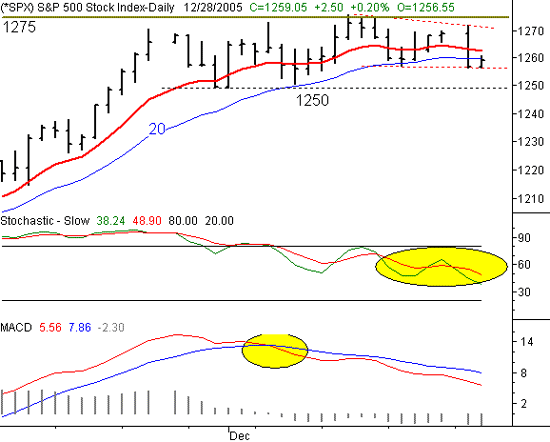
The S&P 500 is showing us a little bullishness today, but faces the same hurdles as the NASDAQ. Specifically, after the fall under the 10 and 20 day averages, the SPX is meeting resistance with the attempt to get back above the 20 day line. The 20 day average is currently at 1260. Today's high of 1260.70 obviously topped that, but the SPX's current reading of 1259.05 clearly shows that this is a trouble spot.
And it's worth noting that the S&P has already made a low under last Thursday's low of 127.20 (something that can't be said about the NASDAQ), so we know investors aren't lurking, waiting to buy on a pullback to previous levels. In fact, from a micro perspective, the S&P 500 is now in a bearish channel. We just made a lower low after making a higher high, indicating a significant shift in momentum. This newly-formed channel is traced with red dashed lines on the chart below. Subtle? Yes. Significant? Mildly.
The bigger picture still shows a flat/neutral market more than anything else, but with a slightly bearish bias. We're now several days into MACD and stochastic sell signals, and they're both still going lower. However, the comfort zone remains between 1250 and 1275, and until the S&P 500 breaks free from that, we don't think there's going to be a whole lot to discuss.
S&P 500 Chart - Daily

Dow Jones Industrials Commentary
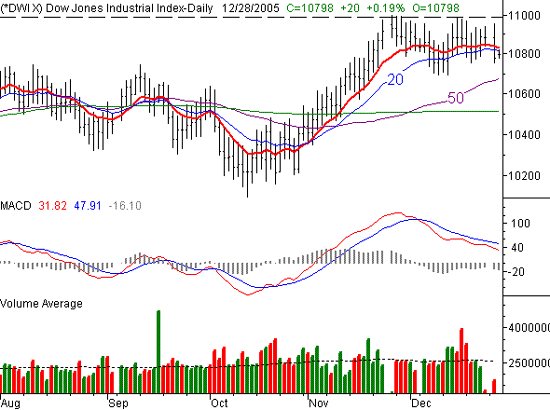
The Dow is turning in a tepid performance too, and like the S&P, it's not going to be enough to pull the chart back above the 10 or 20 day averages. The 10 day line is at 10,831, so we'll put short-term resistance there for the time being. The bigger-picture resistance is still at 11,000. As for support, the next checkpoint is the 50 day line, at 10,677. But fore this chart, as seen with the MACD lines, the momentum is steering things lower.
Dow Jones Industrials Chart - Daily

Price Headley is the founder and chief analyst of BigTrends.com.