This week, as we celebrate the beginning of a new year, we're going look at our daily charts as usual. But we're also going to step back and look at some bigger-picture scenarios. It may be wise to keep both the short-term and long-term as we navigate through 2006.
NASDAQ Commentary
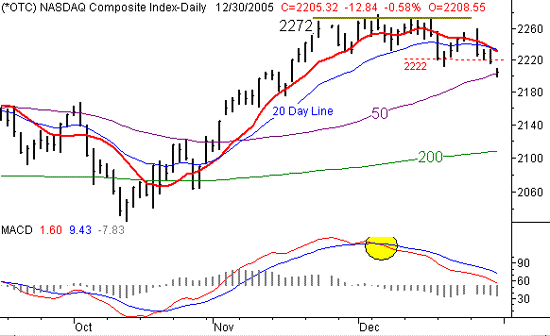
The NASDAQ lost 44.1 points last week to close at 2205.32. The 1.96% selloff left the composite at its lowest close in eight weeks, and poised for more downside movement. Most of the support that had been holding the index up was finally broken.
Specifically, the support at 2213 (last week's low) was breached on Friday. This is the first time we've made a significant lower low on months, although it had been a long time in the coming. The bearish MACD crossunder occurred on the 7th, and we've been in distribution mode (rising bearish volume) throughout the last couple of weeks. We've also made a couple of closes under the 19 and 20 day average lines, confirming another short-term sell signal. In fact, the 10 day line is now under the 20 day line for the first time since early November (yet another sell signal)
So, the momentum is bearish. Resistance is now at 2230, where the 10 and 20 day lines reside. As for where this downtrend could end, that's not quite as clear. The 200 day average is at 2108, which would allow for a rather big fall. Then again, the November rally left the NASDAQ ripe for a big fall. In the meantime, it's worth noting that the NASDAQ's dip - at least for now - was stopped at the 50 day line. The close at 2205 on Friday was just a hair above the 50 day average at 2203. So, don't be surprised to see the bulls make a stand for a couple of days. The big selloff last week has left some pretty juicy values for those who prefer to buy on dips. We just don't think there are enough of them now to undo the damage that was inflicted over the previous four days. (The weekly chart analysis appears below.)
NASDAQ Chart - Daily
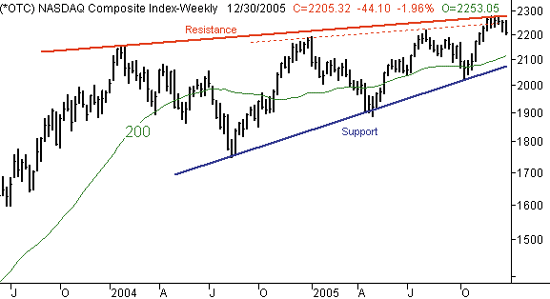
On the weekly chart, the NASDAQ's turn isn't a surprise at all. This is the same pattern we've seen since early 2004. The composite hits a major resistance line, then pulls back to a major support line. Oh, both lines are rising, so the larger trend is a bullish one. But this range also leaves a lot of room for sustained pullbacks (on the order of 4 to 6 months). As you'll see, that support is just under 2100 right now, but rising. To set some perspective, to fall another 100 points would be less than a 5% dip. That's not fun for the bulls, but it's nothing unusual. If we tack that 5% on to what we've already given up over the last couple of weeks, it would still only total about 7% worth of selloff.
NASDAQ Chart - Weekly
S&P 500 Commentary
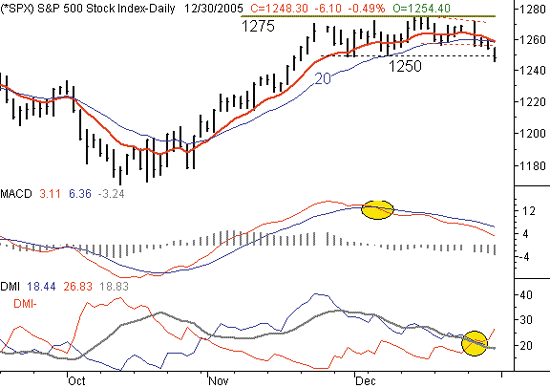
The story for the S&P 500 is pretty much the same. Last week's low of 1250 was broken with a close at 1248.30 on Friday. The SPX lost 20.35 points in last week's 1.6% dip, which set in motion a rather bearish trend. That action finally made good on the MACD crossunder from weeks ago, but we also have a fresh bearish DMI crossover now. From here, there's not much left in the way of potential support. The 50 day line and 200 day line are at 1240 and 1210, respectively, but we don't anticipate those being significant support levels. But of the two, the 200 day line at 1210 is the more important. That's 38 points away, which leaves enough space for another 3.0% worth of loss. Resistance is at 1258, where the 10 day line is right on the verge of falling under the 20 day average.
S&P 500 Chart - Daily
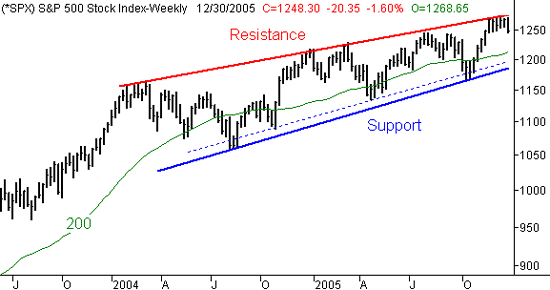
The S&P's weekly chart also looks the same as the NASDAQ's. There are bullish support and resistance lines generally guiding the index higher, but they leave some room for significant pullbacks. The SPX had been pushing up against that resistance line for about the last five weeks, but the lack of progress finally deflated the conviction of the bulls. From here, the potential for a pullback to 1180 isn't unrealistic. The chart tells the story.
S&P 500 Chart - Weekly
Dow Jones Industrial Average Commentary
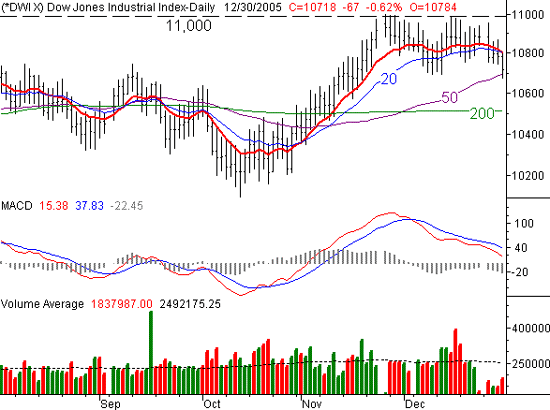
Rather than focusing on the daily chart for the Dow (which would be a little redundant), we'll spend most of our time here on the monthly chart. But, we still need to make a couple of notes about the short-term outlook for the blue-chip index. Basically, we have the same short-term bearish outlook described above. We've seen several closes under the 10 and 20 day line now, with resistance being seen at the 10/20 day lines on Friday. Given that we've been unable to make any upward progress for a month, a downside move isn't a surprise. However, the daily chart also showed support at the 50 day line on Friday, so we may not make a beeline to lower readings. Resistance is at 10,800, then again an 11,000.
Dow Jones Industrial Average Chart - Daily
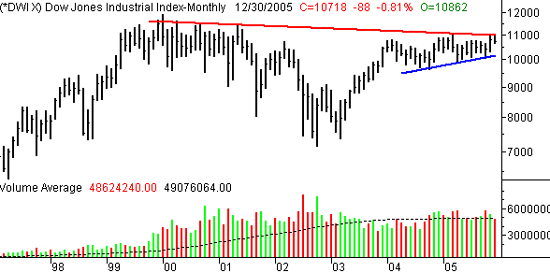
The monthly chart of the Dow, though, is the one we found much more interesting. Although the Dow has basically recovered from the bear of 2000-2002, these stocks have been relatively unimpressive in a very big way. This index was the only one to not recently make new 52-week highs. More than that, from a technical perspective, it appears as if the Dow is still grappling with bearish resistance that extends back to early 2000. That's right - early 2000. That's obviously not a good sign for those investors relying on tried-and-true Dow companies. So, while we've been discussing the resistance at 11,000 with a little conviction recently, we may not have been doing it justice. This is a major resistance level.
On the other hand, once it is broken, the Dow will be the first index to reach new multi-year highs; the other indexes are nowhere close to their 2000 peaks. That's just the result of having survived the bear market a little better than the S&P or the NASDAQ. In the meantime, it looks like this resistance was strong enough to put an end to the buying for now. The index looks poised for a possible pullback to the rising support line, currently at 10,100. That's no small correction, but it's not an unusually large one either.
So, our take is this.....the Dow has a problem. But, once that problem is fixed, the Dow could emerge as the leading index. Think of it as a coiled spring. Just be patient, as it could be a while for that pent-up tension to be unleashed. The index may even need to fall all the way back to that 10,100 mark to get the proper running start.
Dow Jones Industrial Average Chart - Monthly
Bottom Line
The slate is essentially clean in the minds of most traders. So, all the nuances of 2005 (and there were plenty of quirky ones) are nothing but a memory, at least for the time being. Some of the market tendencies that may be best forgotten in 2006 are the likelihood of a reversal, and range-bound trading. Both of those qualities pop up from time to time in the market, but for 2005, we saw an unusually high degree of those characteristics. We may indeed see them again in 2006, but we don't think we'll see it quite as much. Why? The mixed messages that plagued 2005 won't be quite as potent in the coming year. Those mixed messages include (1) a Fed that couldn't decide if inflation was a problem or not (they finally decided it wasn't), (2) oil prices that hit record highs, then flatlined, and (3) two major hurricanes that were supposed to be devastating, but have since then been forgotten by most everyone except the folks directly affected by them. That's a virtual tug of war for the market, and the charts show it. In 2006, we expect to see a little more consistency, or longer, bigger moves. That's not to say they'll all be bullish or bearish - we just think that the environment will be less choppy, with better trends (both up and down).
The only thing we'll add is this - don't forget how 2005 started out. The end of 2004 was overwhelmingly bullish, as was the first hour or so of 2005. Then it all went south for several weeks. The reason we bring it up now is to warn everyone not to assume this past week's selloff is guaranteed to carry through into next week. It might, but don't assume anything. We should know in very short order what the market has in store for the beginning of 2006. The momentum is bearish to be sure, and disappointing Christmas retail sales are likely to spark some selloffs, led by the retailers. But, you're far better off acting on what the market is actually doing, rather than what you think it should be doing. As we said, 2006 is a clean slate, for many reasons.
Price Headley is the founder and chief analyst of BigTrends.com.