We post 14 different futures biases each trading day on TigerSharkTrading.com. The following charts are the TradeStation summaries of all 14 biases. To review the 14 biases, click here for the full list and explanation. Each chart contains six columns of data: (1) Total Net Profit, (2) Total Number of Trades, (3) Percent of Trades Profitable, (4) Average Trade Net Profit, (5) Maximum Drawdown, and (6) Return on Account. The account size is assumed to be the Maximum Drawdown, so the Return on Account (ROA) calculation is simply the Total Net Profit divided by the Maximum Drawdown times 100. The time period covered for a trading bias summary is given directly below each chart.
Figure 1: 2-day/5-day Averages
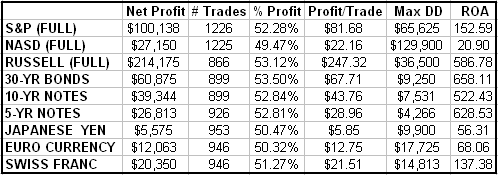
January 2, 2001-November 19, 2005
Figure 2: 40-day Average Close
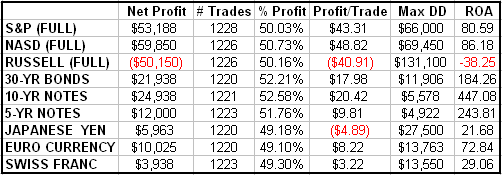
January 2, 2001-November 19, 2005
Figure 3: 50-day Highest High
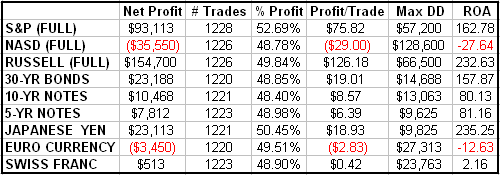
January 2, 2001-November 19, 2005
Figure 4: 10-day Average Range
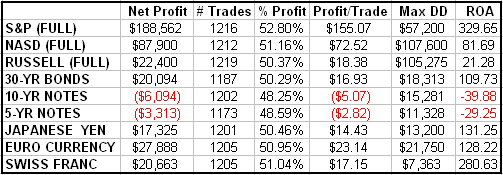
January 2, 2001-November 19, 2005
Figure 5: 15-day Median Close
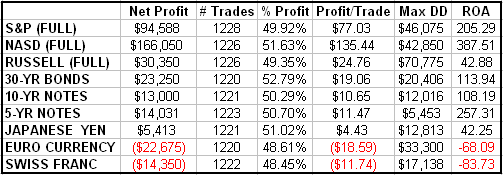
January 2, 2001-November 19, 2005
Figure 6: Majority 3-Day Open-Close

January 2, 2001-November 19, 2005
Figure 7: 4-day Indicator
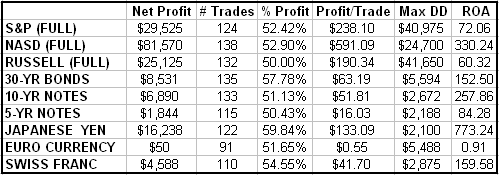
January 2, 1996-November 19, 2005
Figure 8: 5-day Indicator
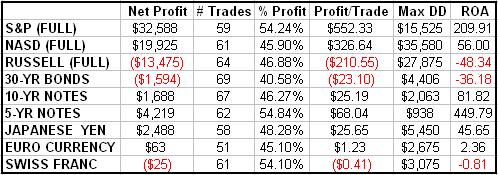
January 2, 2001-November 19, 2005
Figure 9: 3-day Cup or Cap
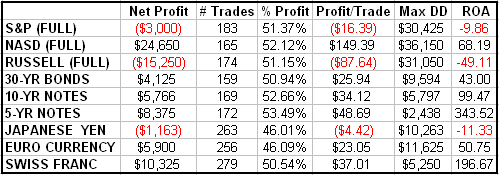
January 2, 2001-November 19, 2005
Figure 10: 3-day Support-Resistance
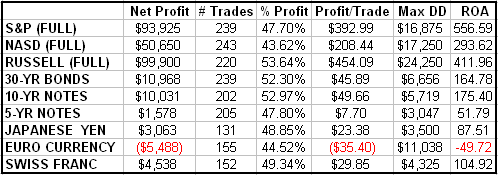
January 2, 2001-November 19, 2005
Figure 11: 2-Day Same Open-Close
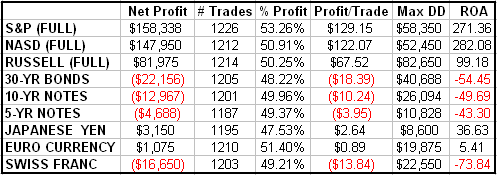
January 2, 2001-November 19, 2005
Figure 12: Day-of-the-Week

January 2, 2001-November 19, 2005
Figure 13: Day-of-the-Month

January 2, 2001-November 19, 2005
Figure 14: Month-of-the-Year

Inception-November 19, 2005
DISCLAIMER: It should not be assumed that the methods, techniques, or indicators presented in this column will be profitable or that they will not result in losses. Past results are not necessarily indicative of future results. Examples presented in this column are for educational purposes only. These set-ups are not solicitations of any order to buy or sell. The author, Tiger Shark Publishing LLC, and all affiliates assume no responsibility for your trading results. There is a high degree of risk in trading.
Art Collins is the author of Market Beaters, a collection of interviews with renowned mechanical traders. E-mail him at artcollins@ameritech.net.