| The Wagner Daily ETF Report For October 18 |
| By Deron Wagner |
Published
10/18/2012
|
Stocks
|
Unrated
|
|
|
|
The Wagner Daily ETF Report For October 18
Stocks got off to a positive start in the first hour of trading but found difficulty adding to gains in the afternoon, with most averages basically chopping around in to the close. Small and midcap stocks outperformed, with both the S&P Midcap 400 Index ($MID) and small-cap Russell 2000 Index ($RUT) gaining 0.8% on the day, easily beating the next best gain of 0.4% by the S&P 500 Index ($SPX). Noticeable laggards on the day were the Nasdaq Composite (up 0.1%) and the Dow Jones Industrial Average ($DJIA) (flat at 0.0%). The weakness in the Nasdaq is not much of surprise, as the Nasdaq 100 has undeperformed the S&P 500 the past few weeks and did so again on Wednesday, with AAPL closing 0.8% lower. As for the Dow, it did manage to hold in a tight range, fighting off IBM's nasty 5% sell off on heavy volume.
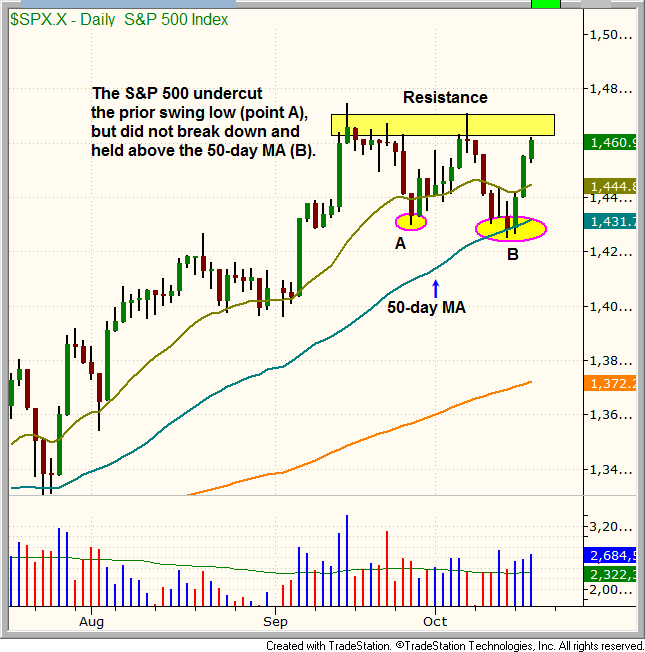
While the sharp bounce off the lows in the market has worked off the oversold readings, the averages are now approaching significant resistance. This is where the rubber meets the road. How the averages react in terms of accumulation distribution at key resistance levels should tell us what type of market we are in (is this a short-term bounce or the start of a new rally).
The S&P 500 is clearly in better technical shape and could stall out at the highs, pullback to support of the 20-day EMA, and still be in solid shape.

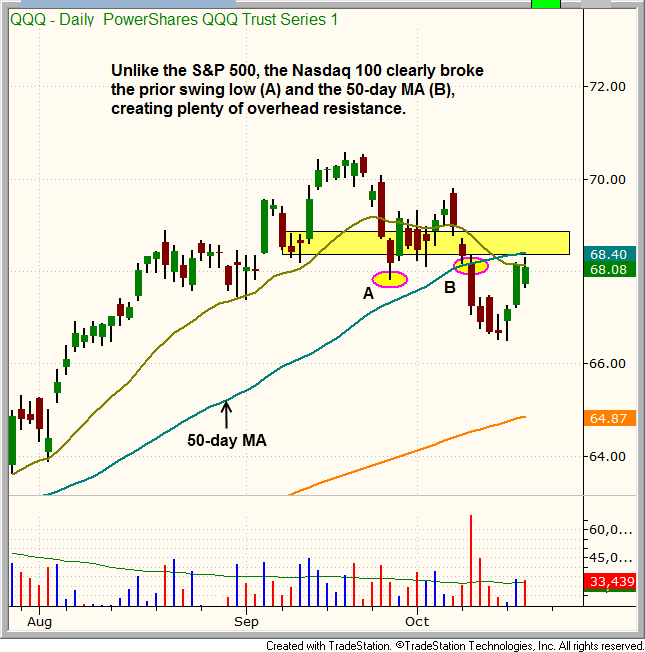
The Nasdaq 100 ETF ($QQQ)is approaching plenty of overhead resistance in the 68.00 - 69.00 area. We's like to see the Q's close back above and hold the 50-day moving average within the next week or two. Whether or not this will happen before another test of the recent swing low remains to be seen, but there are quite a few big cap Nasdaq stocks dragging the index lower (APPL, BIDU, PCLN, ORCL, and QCOM are a few).

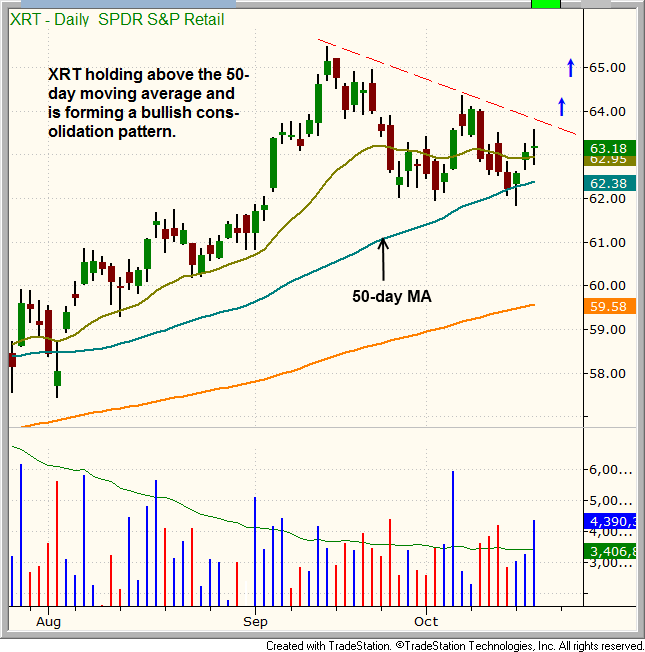
Like the S&P 500, SPDR S&P Retail ($XRT) has held above its 50-day moving average during the correction. $XRT's base is also above the prior highs of April, which are not shown on the chart below. Once prior highs are cleared, the resistance should turn in to support in a healthy market. $XRT could offer a potential low risk entry point within the next several days if the price action can tighten up in the 62.50 to 63.50 area.

Deron Wagner is the Founder and Head Trader of both Morpheus Capital LP, a U.S. hedge fund, and MorpheusTrading.com, a trader education firm.
|