While thinking about insurance can make anyone glassy-eyed, as an investment, it might pay to look deeper into this industry's relative strength. In 2005, the S&P Insurance Index (IUX) gained 12.8%, while the S&P 500 did well to gain 3.0%. Plus, unlike most of the market right now, the insurers appear as if they have a little bullish momentum behind them. And if you know where to look, picking out the best opportunities within this industry may net a trader even better result. But first, let's look at the S&P Insurance Index chart to establish our outlook.
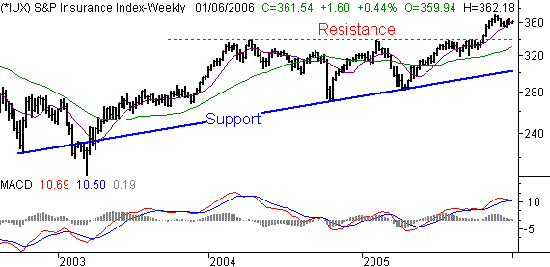
The primary bullish signal here is the move above 338. The index had hit resistance there three times since the beginning of 2004, and it looked like it might hold the line again during this last pass in September. But in mid-October, this insurance index broke past that line to move to new multi-year highs. We saw nice follow-through in November, as did the whole market. And we've seen sideways movement in December, as did the whole market. But, on a weekly chart, it's still clear that the insurers have much more to offer than most other sectors might.
S&P Insurance Index (IUX) - Weekly

That said, the broad insurance index is not without its liabilities. November's rally is now being net with selling pressures, and the momentum is turning south as of the time of this writing. So, this is not a 'right here, right now' kind of outlook. In fact, we'd specifically wait for a pullback and subsequent bounce before thinking about jumping in. The 50 day average is managing to keep the index aloft right now, but if that line breaks, look for a dip back to the 338 area. When strength renews there, that's when we'll start looking to buy into the industry.
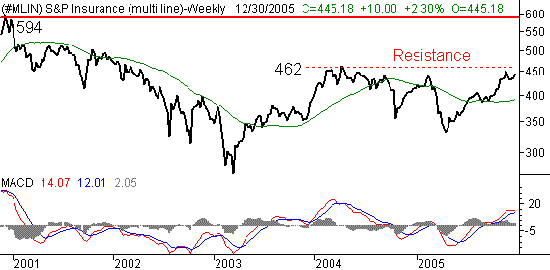
In the meantime, there are a couple of areas within the industry that seem to have a little more potential than other areas. Specifically, we like the way the multi-line insurers are looking to soon reach new highs. The S&P Multi-Line Insurer Index (MLIN) hit 462 in early 2004, and hasn't been back there since then. But, last week's close at 445 puts the index back in striking distance of new multi-year highs (and leaves behind enough momentum to actually clear that hurdle). Once that level is reached, it's possible that this index could re-reach the 2001 high we saw in early 2001. That seems lofty - and it is - but these stocks have a way of quietly putting up big numbers once they get some momentum.
S&P Multi-Line Insurer Index (MLIN) - Weekly

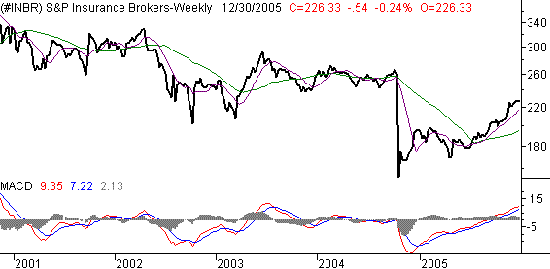
The insurance brokers are the most deeply undervalued pieces of this pie. They all got hammered in late 2004, but have made a very solid recovery since then. And from a momentum perspective, this group is the one that looks like it won't have any issues with being overbought. The S&P Insurance Broker Index is currently at 226, and rising.
S&P Insurance Broker Index (INBR) - Weekly

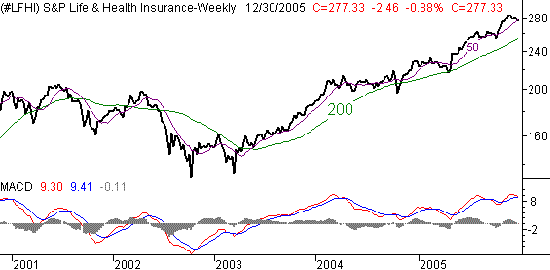
On a relative basis, the life & health insurers are the strongest stocks in the industry. The S&P Life & Health Insurance Index (LFHI) is already at new multi-year highs. In fact, it's been making new all-time highs since April of last year. While we'd normally be fearful of any chart that looks as overbought as this one does, it's clear that the market doesn't mind buying into this strength. All the same, it pays to pick and choose your entries. The 50 day average has been support several times in the last few months. In fact, it is right now as well. That could be a good buy point, but given the nature of this long-term trend, we'd prefer to buy when the 200 day average is retested. That could be a while, but would be worth the wait, especially when it looks like this chart is poised for a brief pullback.
S&P Life & Health Insurance Index (LFHI) - Weekly

As always, use stops - even for these non-specific observations we make on sectors. In the cases above, the 200 day lines might be the most appropriate exit levels, if that long-term moving average doesn't provide support on the next retests.
Price Headley is the founder and chief analyst of BigTrends.com.