NASDAQ Commentary
Although yesterday's huge rally wasn't enough to make us rethink our bearish posture, seeing today's follow-through definitely puts the downtrend in question. As always, though, we want to see what happens at the close - that's the most important price of the day. As of right now, the NASDAQ is up about 11 points (+0.5%) for the day, and up about 50 points (+2.2%) for the shortened week. But a lot can happen in only a few hours. Let's be patient here and not jump the gun.
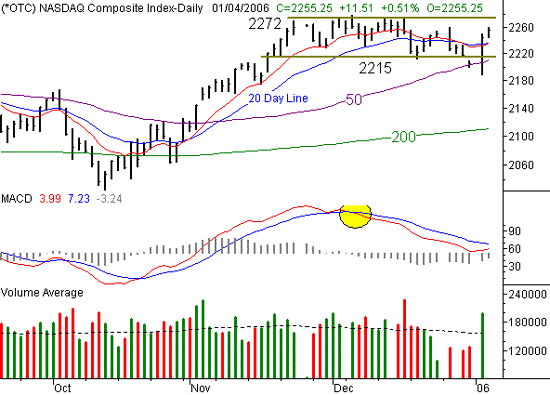
In the grand scheme of things, seeing the composite come back to the mid-2200 area shouldn't be stunning. That's the range (2215 to 2275) the index was stuck in for the better part of December. The lower edge of that range - the support line - was finally breached on the last day of 2005 when the NASDAQ fell as low as 2200.51. We thought that might finally be the move that would get the index out of the rut, and lead to a downside move. In fact, stocks did indeed move even lower on the first trading day of this year, when they hit 2189.91 on Tuesday. But at that point, sparked solely by the Fed (there was nothing on the chart that caused it) stocks started to soar, and didn't look back.
We're always hesitant to follow the crowd, especially when the move is based upon emotions and euphoria. Those rallies are almost as short-lived as the feelings that initially caused by them. But in this case, could the biased move (the response to the Fed) actually have led to the unbiased shift in momentum? That's a distinct possibility. In other words, while we're not willing to get bullish just because the market responded favorably to the Fed, we'd have to get bullish if the technical chart readings turned that way (regardless of the underlying reasons). That's just the discipline of being a trader.
The key buy signal, then, would be a second and higher close above the 10 and 20 day averages. As it stands now, we're on track to do that. But as we mentioned (and stressed) above, where we close today will be a far more important factor in making that decision.
In the meantime, the burning question is whether or not Tuesday's rally was real, or artificial. It looked pretty good, but we're very suspicious of it.....even in the face of today's buying. We acknowledge that it's a new tax year, which can lead to some volatility. But could things have really changed that drastically over one long weekend? It's doubtful, although based on what we see right now, the rest of the market doesn't quite believe that. So, from our perspective, going long now is a dangerous proposition. Only a close above 2272 (a new 52-week high) would negate our concern and sway our outlook to a bullish one. That might also coincide with a MACD crossover. On the other hand, going short right now looks tough to do as well. Only a close back under 2215, or under the 50 day average, would inspire us to start thinking like bears again.
The best way to play this might be to wait and see, BUT, be sure to read our S&P 500 commentary below for more details about some challenges the bulls will be facing soon.
NASDAQ Chart - Daily

S&P 500 Commentary
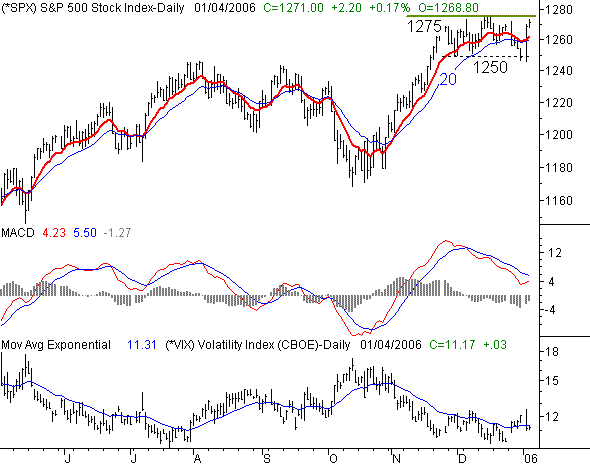
As far as charts go, the S&P 500's is about the same as the NASDAQ's. The large-cap index was stuck in a range between 1250 and 1275 for most of December, but the close at 1248.30 on December 30th led us to believe that the downward momentum was finally going to take shape. But, the bulls had a different idea yesterday. The SPX flew back above its 10 and 20 day averages, and are making another small gain today.
Unlike the NASDAQ, though, the SPX is right on the verge of a new 52-week high, which would include a break above that key resistance level. Today's high (so far) has been 1273.25, while the most recent peak (from 12/14) was 1275.80. That's just 2.55 points away, so a lot of anxious eyes are on the S&P 500 right now. A break past that mark would clearly be bullish, and if the NASDAQ could match it, it could spark a major rally.
But, there's a chink in the bull's armor. Despite the fact that we started the year off with a bullish bang, the CBOE Volatility Index (VIX) is back to alarmingly low levels. The current reading of 11.17 is just a little more than a point above the multi-year low of 9.88 we saw in July. The problem (for the bulls) is that true rallies never start with the VIX this low. In fact, the opposite is typically the case. The two biggest recent rallies (from May and October of last year) were both kick-started when the VIX was at relative highs, and starting to move lower. As the VIX chart at the bottom of our graph illustrates, the VIX is at extreme lows, and actually itching to move higher. Something's got to give, because the market and the VIX can't both move higher in the short-term. We suspect that the VIX will win this war, and provide an end to this current wave of buying.
That said, nothing is ever set in stone....we're also caught in the middle with the SPX chart too. As unlikely as it would be for the S&P 500 to go higher and send the VIX even lower, it was equally unlikely in May, June, and July. So, as with the NASDAQ, we'd want to see a close above 1275 before we were convinced that this rally is for real.
S&P 500 Chart - Daily

Bottom Line
At the very least, it should be an interesting week. The Fed seems to have inspired investors, which is a little odd, in that nothing they said on Tuesday was 'news'. The fact that construction spending was down (as was manufacturing activity) was glossed over by the media, by traders, and by just about everybody. It's not that we respond to the news (we're contrarians), but we still realize that most of the market does respond to news. And what we've seen so far is the philosophy that 'the glass is half full'. The sentiment - regardless of the reason - is bullish. But as we said above, how much longer can that excitement last? Statistically speaking, not very long, but if we do indeed see the market reach new highs, then all bearish bets are off (and the market has a knack for ignoring statistics). We'll have an update in Saturday's Weekly Market Outlook.
Price Headley is the founder and chief analyst of BigTrends.com.