| The Wagner Daily ETF Report For November 14 |
| By Deron Wagner |
Published
11/14/2012
|
Stocks
|
Unrated
|
|
|
|
The Wagner Daily ETF Report For November 14
Although our market timing system remains in "sell" mode, and our focus remains on the short side of the market, it's never a bad idea to keep an eye on ETFs and stocks that are exhibiting relative strength to the broad market, as these will be the first equities to move higher when the broad market eventually finds support and bounces.
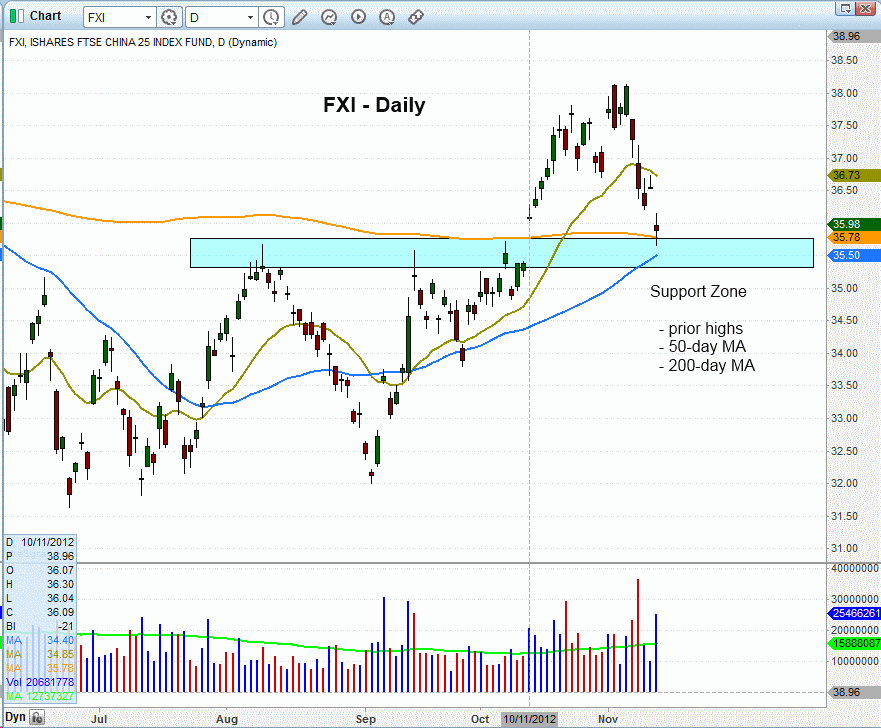
One of the very few ETFs that meets this criteria is iShares Xinhua China 25 Index Fund ETF ($FXI). Although the main stock market indexes of the USA have been in a downtrend since mid-September, FXI actually started trending higher right as the domestic markets started selling off. But despite its relative strength, FXI began correcting last week, and is now in pullback mode. However, this is still an ETF to consider buying if the stock market suddenly surprises us with a confirmed buy signal. Looking at the daily chart of FXI below, notice that FXI pulled back yesterday to close right at support of its 200 day moving average, following an extended run up from its October breakout. Support of the 200-day MA also coincides with new horizontal price support form the prior highs:

At the present time, we are not looking at buying FXI because the domestic broad market has yet to put in a convincing near-term bottom. Still, this ETF should be on your watchlist as one of the first ETFs to consider buying when stocks eventually find a bottom. Therefore, it has been added to our internal watchlist as a potential long candidate, just in case our market timing model happens to shift back into "neutral" or "buy" mode in the near-term.
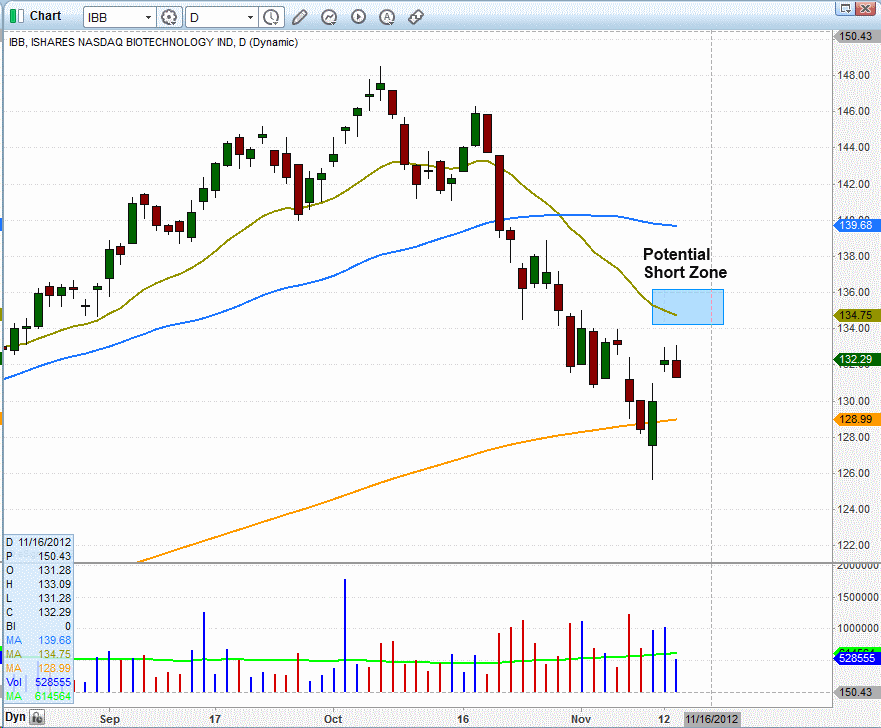
Yesterday, we said there were two ETFs on our watchlist for potential short entry if they managed to bounce into resistance levels that would provide us with low-risk short selling entry points. One of those ETFs was PowerShares QQQ Trust ($QQQ), which we analyzed two days ago. The other ETF was iShares Nasdaq Biotechnology Index Fund ($IBB). Take a look at its current chart pattern:

Although IBB was a market leader throughout most of 2012, it very quickly began showing relative weakness and became a loss leader after the ETF began correcting in early October. Now, it is bouncing off support of its 200-day moving average, and we're hoping it will have enough bullish momentum in the coming days for it to probe above resistance of its 20-day exponential moving average, and to near resistance of its 50-day moving average. If it does, it will present us with an ideal, low-risk short selling entry point, in anticipation of another move down to at least re-test the prior lows of a few days ago. IBB is not yet on our watchlist as an "official" short entry, but we are monitoring its price action and will alert subscribers to a potential short sale entry point if it provides us with a proper, low-risk trade setup.
High volatility and intraday indecision, such as was exhibited in yesterday's broad market action, can be nerve-racking and frustrating for short-term swing traders. However, there is one benefit to such price action. Since stocks formed a similar pattern (morning strength followed by afternoon weakness) on November 9, we now have two failed intraday rally attempts within the past three days. The benefit of this is that it makes it easy to adjust protective stop prices on short positions because if the main stock market indexes manage to rally above their three-day highs, bullish momentum will probably move stocks substantially higher in the near-term.
Because of the price action described above, we have trailed most of the protective stops tighter on our ETF positions much tighter, generally to just below yesterday's lows. In the case of the inverse ETFs, this would basically correlate to breakouts above yesterday's highs in the major indices. Presently, our model trading portfolio is showing an unrealized gain of approximately $1,100 (just over a 2% portfolio gain based on the $50,000 model account value).
Now that we have trailed stops higher, we should still be able to lock in substantial gains with our ETF trades, even if the major indices suddenly jump back above their three-day highs. Nevertheless, the weak action of the past three days means there is equally a chance that stocks could now tumble to new lows, due to the back to back failed reversal attempts (including the November 12 "inside day"). If that happens, our existing short and inverse ETF positions would realize substantially larger gains, and we would then immediately trail the protective stops even tighter, or look to take profits, the following day.
Deron Wagner is the Founder and Head Trader of both Morpheus Capital LP, a U.S. hedge fund, and MorpheusTrading.com, a trader education firm.
|