| The Wagner Daily ETF Report For November 26 |
| By Deron Wagner |
Published
11/26/2012
|
Stocks
|
Unrated
|
|
|
|
The Wagner Daily ETF Report For November 26
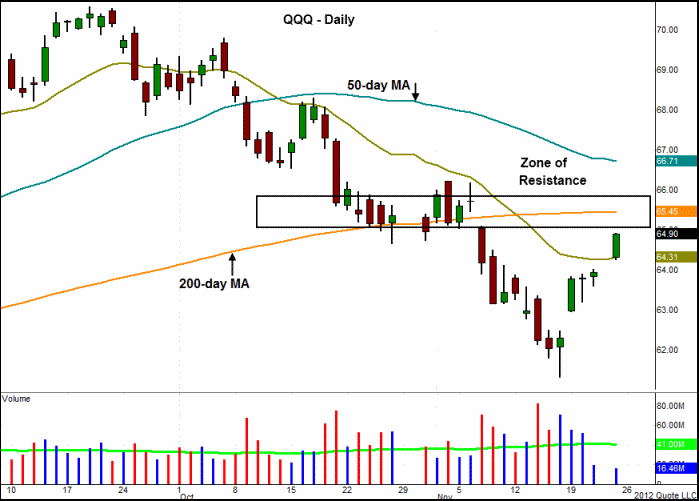
It was obviously positive that stocks continued building on their gains since bouncing off their mid-November lows, and did so on higher volume last Friday. However, it's still too early to declare an end of the broad market's multi-month downtrend from its September 2012 highs. One of the biggest reasons we say this is because the main stock market indexes still have an abundance of overhead supply to contend with. Furthermore, several of the major indices are now bumping into, or are quickly approaching, key technical resistance levels. One good example of this can be seen on the daily chart pattern of PowerShares QQQ Trust ($QQQ), a popular ETF proxy for trading the Nasdaq 100 index:

As you can see, QQQ broke out above resistance of its 20-day exponential moving average last Friday. However, notice the horizontal price resistance just overhead, which was formed by the prior swing lows from late October, as well as the prior highs from July. Furthermore, the 200-day moving average, which formerly acted as support and now will provide formidable resistance, is less than 1% above the current price of QQQ. Above that resistance level is the 50-day moving average, which has been sloping lower since mid-October, and is in danger of crossing below the 200-day moving average.
Another key broad-based ETF, the iShares Russell 2000 Index ETF ($IWM) has a similar chart pattern to $QQQ. The one difference is that it has already bounced to close right at its 200-day moving average last Friday. Furthermore, $IWM is still trading below the upper channel of its downtrend line from the September 2012 highs (the red line on the chart below), which may be difficult to overcome on the first few attempts. Take a look:

We'll be closely monitoring the price action of both $QQQ and $IWM in the coming days, as the ability or inability of these indexes to move back above their 200-day moving averages, horizontal price resistance, and trend channel resistance may determine the tone of the broad market trend for the rest of the year. We focused on these broad-based ETFs, rather than the S&P 500 SPDR ($SPY) and Dow Jones Industrial SPDR ($DIA), because they better represent the performance of leading stocks (solid breakouts of leading individual stocks is a key component of a healthy market). Additionally, $QQQ and $IWM showed the most relative weakness of the broad-based ETFs on the way down, so they have the most technical damage to overcome.
Although we are still monitoring for new, low-risk entry points on the short side (and/or buying inverse ETFs), we can not ignore last Friday's "accumulation day" (higher volume gains) in the market. However, it's important to realize a market bottom is never a one-day event, so we need to see more evidence accumulate over the next two weeks to confirm that an intermediate-term bottom is in place. Specifically, we need to see convincing breakouts of fresh leadership stocks, while the major indices also need to avoid printing a bearish "distribution day" (higher volume loss) over the next five days.
Deron Wagner is the Founder and Head Trader of both Morpheus Capital LP, a U.S. hedge fund, and MorpheusTrading.com, a trader education firm.
|