NASDAQ Commentary
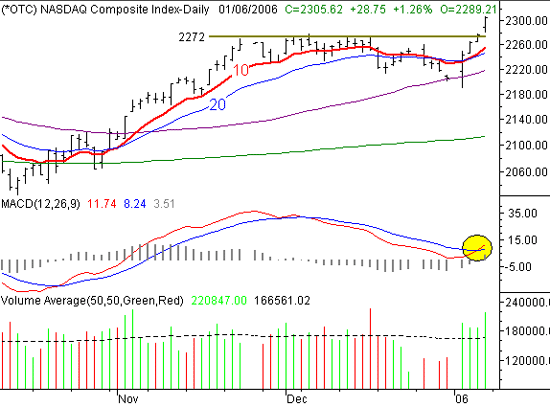
The NASDAQ soared to 2305.62 last week, breaking past some key resistance levels on the way to new multi-year highs. That 100.3 point gain (+4.5%) is even more impressive given that it was a shortened trading week.
The question is, however, is this a real breakout move that will inspire more buying next week? Or, was this heroic week completely in error? The size of the gain was uncanny - one of the best weeks in years! But too often we've seen these bizarrely bullish weeks just completely fall apart when the market comes to its senses. The fact of the matter is this....except for the calendar, there's not a whole lot of difference in underlying factors between now and two weeks ago, when stocks were headed the other way.
On the other hand, there are always disbelievers at the beginning of unexpected trend changes. It's an easy trap to fall into. So, the real trick is to be rational - not emotional. Or in this case, the challenge is to be technical instead of feeling like you have to chase an uptrend. The thing is, we're not convinced that this uptrend is for real. So here's what we're looking for in the coming week.......
The resistance at 2272 was broken last week, so that's no longer worth watching. Although it was a technical breakout, we still want to see how the market responds once we start to see a little selling (it's easy to be a bull in a rising market). The 10 day average is at 2256 - about 50 points under where the NASDAQ is now. Let's wait for a pullback to that mark and see if it acts as support or not. Just keep in mind that the 10 day line is rising, so adjust that reading as needed. If it does act as support, then great - we'll concede to the bulls. But if not, we may want to be careful how we navigate past that. There's a support zone between 2256 and 2217 (between the 10 and 50 day averages). Unless we actually fall under that 2220 area, we won't exactly be turning bearish either. So, sit tight until we get some clarity.
NASDAQ Composite - Daily

S&P 500 Commentary
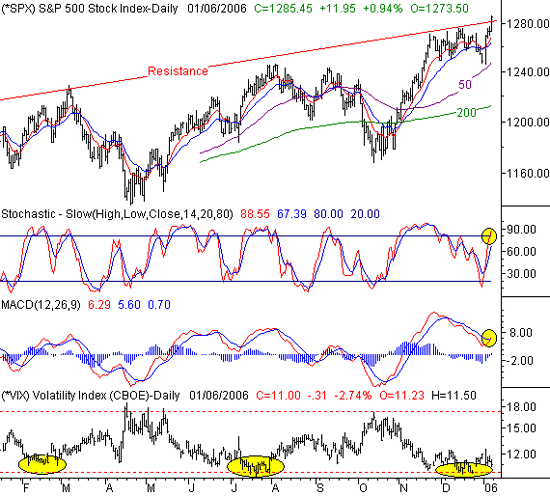
The S&P 500 wasn't quite as explosive as the NASDAQ was last week - it only rallied by 3.0% to close at 1285.45. That 37.15 point addition, though, is still very impressive.
We'll be short and sweet here, since the same stuff can be said about the S&P 500 that was said about the NASDAQ.....it looks like its on fire, but it's really quite vulnerable.
But first, what's bullish.....
We've got a MACD crossover, and a break to new highs. So, technically, we've got bullish momentum.
What's bearish?
A mixture of being well overbought, and some sound reasoning. A 3.0% rally in one week? We fully acknowledge that the market is rarely well-paced, but where was all this buying two weeks ago? It can make sense to sell in a particular tax year, but that's got nothing to do with buying. What changed? Our first answer is simply euphoria. Traders were excited about a clean slate (a new year), and went wild when it finally got here. But eventually, the fundamentals are going to have to support the technicals. And like we said, there's nothing that fundamentally changed between late 2005 and early 2006 (the Fed's opinion - and wording - wasn't news on Tuesday).
But as always, we want to be disciplined enough to have a good reason to expect a market move - not a gut feeling. And that reason is best illustrated with the CBOE Volatility Index's move to near-record lows again. As you can see from the bottom of our chart, the market doesn't rally when the VIX is this low. Granted, we said the same thing a week ago, but this is the kind of market dynamic that can take a week or two to get traction. See February and July for examples. So, we still contend that the odds favor a dip, regardless of other bullish indicators.
S&P 500 Chart - Daily

Dow Jones Industrial Average Commentary
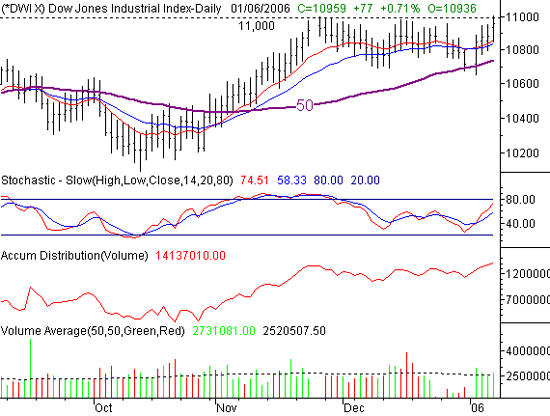
Even the lethargic Dow got in on last week's action. This blue-chip index lagged the other major indices with a 2.25% gain, but that 241 point rally for this average is still quite a feat (considering the stocks that make up the Dow Jones Average). However, the close at 10,959 is still clearly under the major resistance line at 11,000. So, all in all, the Dow continues to face the most hardship......although it's still a rather bullish hardship.
Friday's high of 11,006 is a bit suspicious. The Dow just keeps having trouble there. So as we've been saying for weeks, we're not going to be believers until we can cleanly get above that line. So, in that sense, the jury is still out.
On the flipside, we saw support at the 10 day line all week long. And, the buying volume was strong. So, we're going to be patient here as well and wait for better clarity before making a call.
Dow Jones Industrial Average Chart - Daily

Price Headley is the founder and chief analyst of BigTrends.com.