| The Wagner Daily ETF Report For December 4 |
| By Deron Wagner |
Published
12/4/2012
|
Stocks
|
Unrated
|
|
|
|
The Wagner Daily ETF Report For December
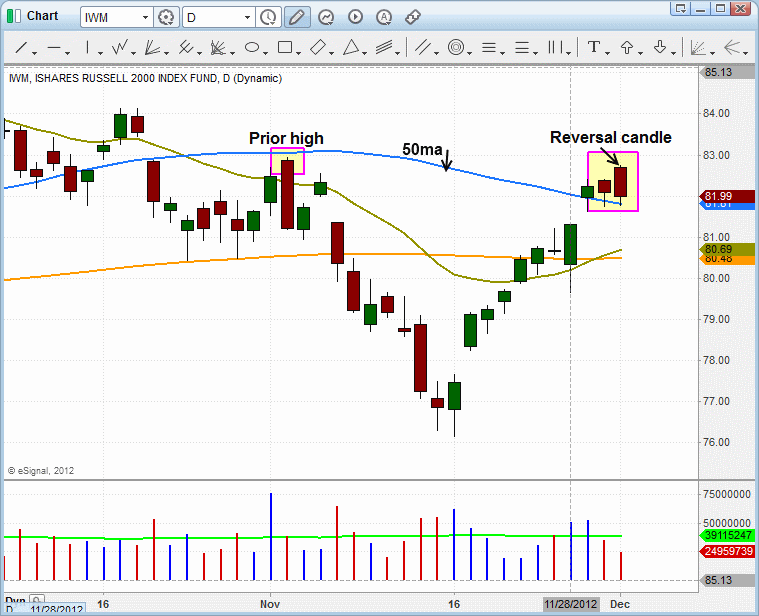
Stocks opened substantially higher yesterday morning, but reversed to trend lower throughout the entire session and finish in slightly negative territory. The price action of the failed gap in the broad market produced reversal candles on the daily charts of broad based ETFs, leading us to a new potential ETF trade setup in the inversely correlated ProShares Short Russell 2000 ($RWM). Since $RWM is a "short ETF," we are basing the potential buy setup on the chart of the small-cap iShares Russell 2000 ETF ($IWM). The first chart below shows $IWM running into resistance of its 50-day moving average and prior swing high:

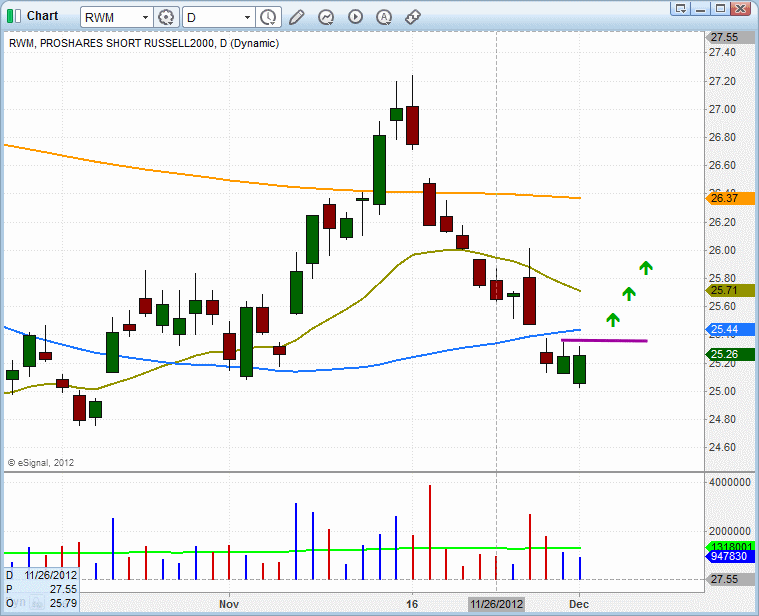
Monday's reversal candle was not the most ideal "bearish engulfing" candlestick pattern because the prior day's action in $IWM was 1) a negative close and 2) a narrow inside day (engulfing such a small candle is not as significant). Nevertheless, it was a decent reversal showing stalling action at the 50-day MA and prior swing high, giving us a low-risk entry point with a clear protective stop price. Rather than selling short $IWM, we are planning to buy $RWM instead (if it hits our trigger price). This benefits subscribers who are unable to sell short because they have non-marginable cash accounts. As shown below, the buy stop in $RWM is just above the two-day high:

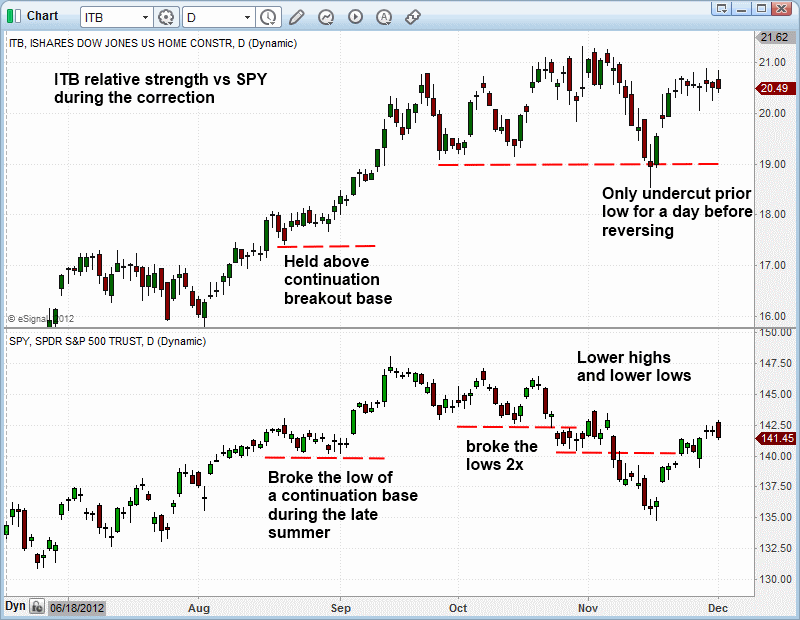
During the recent correction, the iShares Dow Jones US Home Construction ($ITB) showed great relative strength by refusing to break the lows of its base, even as the S&P 500 was breaking down and setting lower highs and lows for several weeks. This pattern of relative strength is easy to see on the comparison chart below:

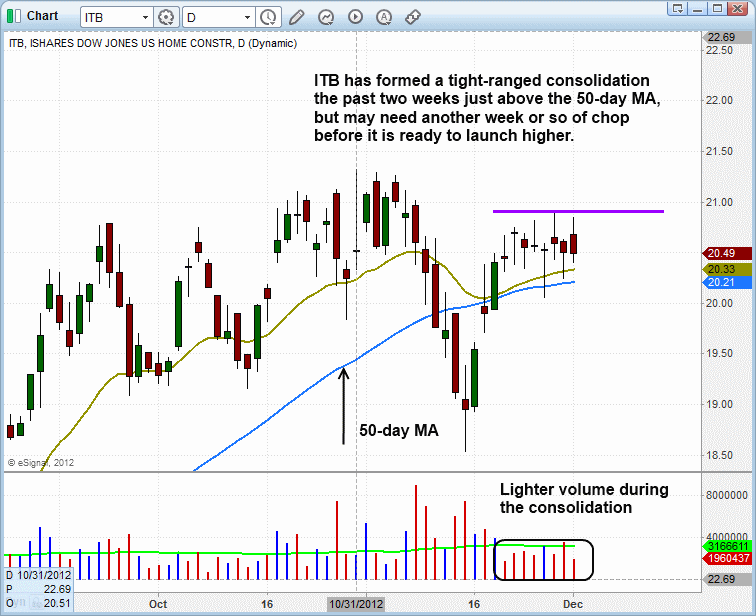
$ITB continues to consolidate in a tight range above the rising 50-day moving average on lighter volume, which makes it an ideal buy candidate on a breakout above $21.00. If the market pulls back in over the next few days and $ITB follows, then we may have a low risk buy scenario develop if $ITB undercuts the 50-day MA and forms some sort of bullish reversal candle:

With the S&P 500 failing to hold yesterday's opening gap up, and reversing to close below the 50-day MA, we could see a short-term retreat in the market. If the pullback is on lighter volume and most leading stocks and ETFs are able to hold their ground, it would certainly be good news for the bulls and a clear sign that the rally is strengthening. But if the market sells off on higher volume and leadership stocks do not hold up as well, then we may need a few more weeks of base building before there is a significant move out (assuming the market is able to hold on to recent swing lows).
Deron Wagner is the Founder and Head Trader of both Morpheus Capital LP, a U.S. hedge fund, and MorpheusTrading.com, a trader education firm.
|