Although we just touched on them a few weeks ago, we want to review the biotech stocks again, as they seem to be setting up another big upward move. Or, to be more accurate, they appear ready to resume a much bigger uptrend that extends all the way back to early 2003. Since the AMEX Biotech Index low of 307 - hit in March of 2003 - we've seen a whole lot of progress here. The index is up 131.9% since then, which is significantly superior to the NASDAQ's 84.3% gain during that time. The thing is, the biotech sector has enough momentum (and fundamental strength) to keep going like it has been.
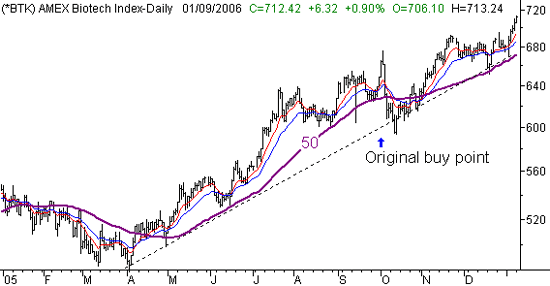
The daily chart, which appears below, illustrates the kind of volatility you can expect to see from these stocks. There's nothing you can do about it, but it's not necessarily a bad thing. Just keep this in mind when establishing your tolerance thresholds (which we will below). We originally went bullish on these stocks on October 3rd, seeking to buy into the breakout move at that time. Our exit point was established at the 50 day average, which was at 627 in early October. The idea was right, in that these stocks did indeed make progress toward our target price of 721. However, the chart went south (in a big way) a couple of days later in the midst of a marketwide selloff. That forced a technical reversal on our stance at that time. However, that's not enough to shake us out of our long term bullish expectations here....it just reminds us that we need to leave plenty of room for volatility.
AMEX Biotech Index (BTK) - Daily

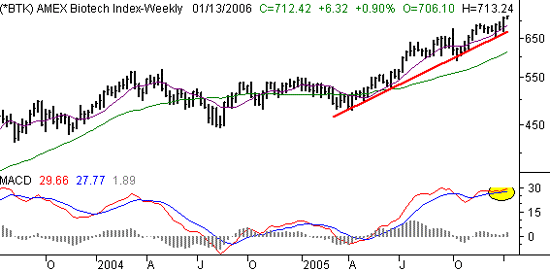
For the forecast and target setting, we'll re-apply a weekly chart. Our key signal is a renewed bullish MACD cross (highlighted). The initial target of 721 from October is now being raised to 839. That's a gain of about 18% from the current reading of 712. And yes, it's a rather aggressive one. However, this index was able to move more than 100 points in just part of 2005. So, a similar move isn't out of the question (especially when considering the underlying fundamentals). This time, we'll set our support/stop level at 650. That's where the 100 day moving average line is (not shown), which seems to leave an appropriate amount of wiggle room. That level should be adjusted weekly to match the 100 day line.
AMEX Biotech Index (BTK) - Weekly

Although it's rarely part of our analysis, we still recognize that the market's interpretation of the underlying fundamentals have an impact on the charts. That's why we're so encouraged with the biotech companies. The average P/E here is 19.45, which is mediocre by market standards, but fairly cheap as far as biotech standards go. They key players in this group are Amgen (AMGN), Genentech (DNA), and Gilead (GILD), all of which currently have outstanding earnings and profit growth. There's also a very liquid exchange traded fund that closely mirrors the AMEX index - the Biotech HOLDRs (BBH).
Price Headley is the founder and chief analyst of BigTrends.com.