- Market: March 2006 30yr. T- Bond (USH6)
- Tick value: 1 point = $15.625 T-Bond options trade in 64ths while futures trade in 32nds.
- Option Expiration: 02/24/06
- Trade Description: Bear Put Ladder Spread
- Max Risk: $406.25
- Max Profit: $1593.75
- Risk Reward ratio 4:1
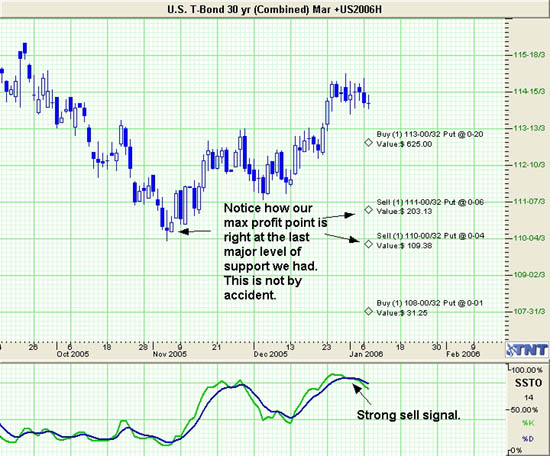
Buy one March 2006 T-Bond 113 put, sell one March T-Bond 111 put, sell one March T-Bond 110 put, and buy one March T-Bond 108 put. For a combined cost and risk of 26 points ($406.25) or less to open a position.
Technical/Fundamental Explanation
I know you have recently seen many ladder trades from us, and I wanted to explain. We continue to do these trades because for the most part they are working! If it ain't broke don't fix it. Ladder spreads have a few features that one should not discount. First of all, by selling out-of-the money options we bring in premium that reduces the cost of the options purchased, and therefore allows us to buy at or even in-the-money options which have a much higher probability of making money than the out of the money options. Also ladder spreads have, if constructed properly, a wide range where they can profit in, unlike most butterfly spreads that have more of an exact target to make max profit. For instance with this trade we have over 4 full basis points in which we can profit at expiration, of which there is 1 full basis point where max profit occurs(see below for further explanation). (1 full basis point = 32/32nds in bonds) So with that in mind we are recommending a put or short position in T-Bonds.
With the Jan. 31st FOMC meeting around the corner, and it being Mr. Greenspan's farewell address to us all, I expect to see a large dog and pony show put on by our government. Bonds had been rallying since the beginning of the 4th quarter of 2005 even in the face of continued interest rate hikes by the Fed. This flew in the face of Econ. 101 and caught many traders by surprise, myself included. Bonds ability to rally further seems to have been hampered by, now get this, reality. The fact that we cannot spend our way out of our current financial situation seems to be setting in for most traders. While there are many arguments that say the Asians need to keep buying our bonds, they are not going to throw good money at bad for too much longer. The now flat yield curve should not be ignored. This severely hurts the entire lending industry, everything from home mortgages to car loans will eventually feel an impact from this now flat curve. A flat yield curve has almost always been a signal of a slowing economy. I am not trying to predict doom and gloom for us all but I cannot ignore reality either. Bottom line on this trade is it is a very low cost way to be holding an at-the-money put for the next 45 days or so while limiting risk and giving you about 4 to 1 on your money. Max profit points, if you notice on the chart below, are between the major support levels we have seen in Bonds.
Profit Goal
Max profit assuming a 26 point fill is 102 points ($1593.75) giving this trade about a 4:1 risk reward ratio. Max profit occurs at expiration with T-Bonds trading between 111 and 110. The trade is profitable at expiration if the T-Bonds is trading any where between 112-19 and 108-13 (break even points) which means we have a band of over 4 full basis points in T-Bonds that we can profit in!(1 full basis point = 32/32nds in bonds)
Disclaimer
Past performance is not indicative of future results. Trading futures and options is not suitable for everyone. There is a substantial risk of loss in trading futures and options.
Matt Odom is the Managing Partner and Energy Analyst and Derek Frey is Head Trader at Odom & Frey Futures & Options.


 Free Festival of Traders Videos