| The Wagner Daily ETF Report For January 10 |
| By Deron Wagner |
Published
01/10/2013
|
Stocks
|
Unrated
|
|
|
|
The Wagner Daily ETF Report For January 10
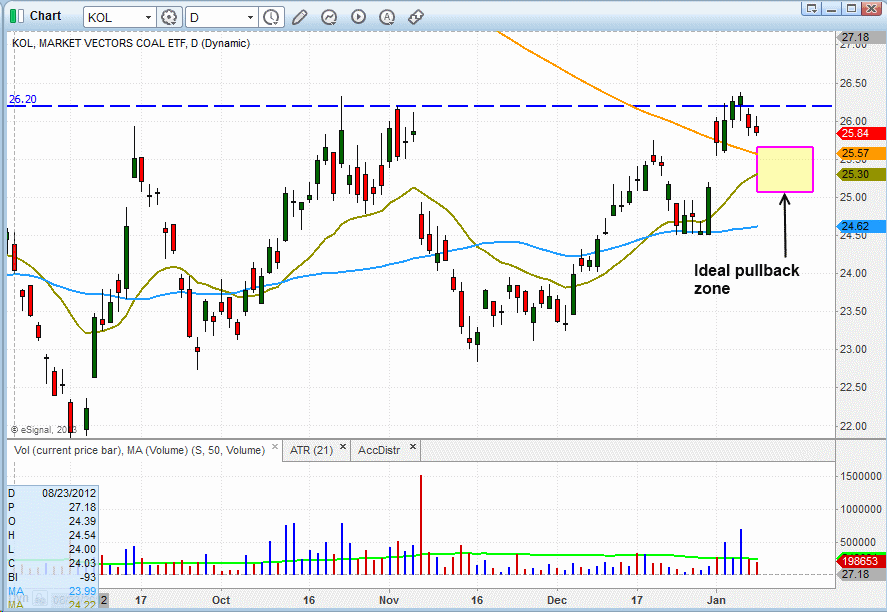
Market Vectors Coal ETF ($KOL), which we initially pointed out in this January 3 blog post as a potential trend reversal buy setup, continues to chop around in a sideways range since clearing resistance of its 200-day moving average on January 2. However, the ETF may now be providing us with an even lower-risk swing trade entry point than last week.
Over the past two days, $KOL has been trading below the $26.25 - $23.35 breakout pivot (the dashed horizontal line on the chart below). It has also been doing so on lighter volume, which is a positive sign. Now, we would ideally like to see the price action retrace down to its 200-day moving average and form some sort of bullish reversal candlestick pattern. If this occurs, it would subsequently provide us with a very low-risk swing trade buy entry.
The area we are looking at for potential buy trigger is somewhere between the 20-day exponential moving average (beige line) and 200-day moving average (orange line), as annotated on the daily chart of $KOL below:

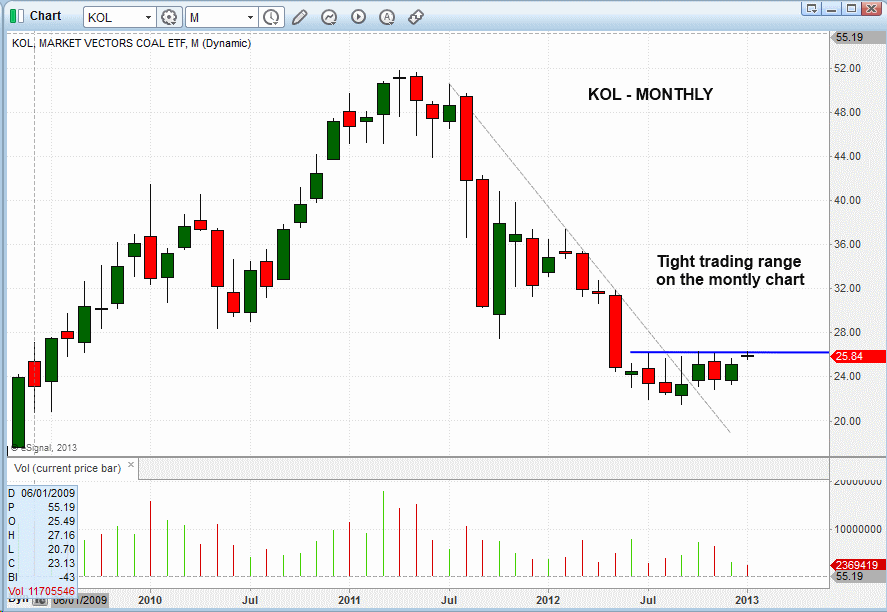
Although we would prefer to enter $KOL as a pullback buy entry, a breakout entry on the next move above the horizontal pivot may be in order if the ETF continues to hold near the highs of its recent range. Zooming out to analyze the longer-term monthly chart of $KOL, the technical pattern becomes even more clear.
After moving above resistance of a downtrend line that was in place for more than a year, $KOL developed a tight base off the lows that has been in place for the past six months. As the above daily chart confirms, the ETF now appears ready to breakout above this extended range. Again, with trend reversal setups, it is crucial to first wait for an extended base to develop at the lows, in order to ensure the ETF has actually found a significant bottom, rather than trying to catch a falling knife:

Based on the follow-up technical analysis above, we are now stalking $KOL for potential buy entry in the coming days. Although we typically focus more on breakout entries and pullback entries of ETFs and individual stocks, we are not afraid to buy when the occasional trend reversal setup with an overly positive reward-risk ratio comes along. As always, regular subscribers to our swing trading newsletter will be notified beforehand with our exact trigger, stop, and target prices for this ETF trade setup if we make an "official" buy entry.
Deron Wagner is the Founder and Head Trader of both Morpheus Capital LP, a U.S. hedge fund, and MorpheusTrading.com, a trader education firm.
|